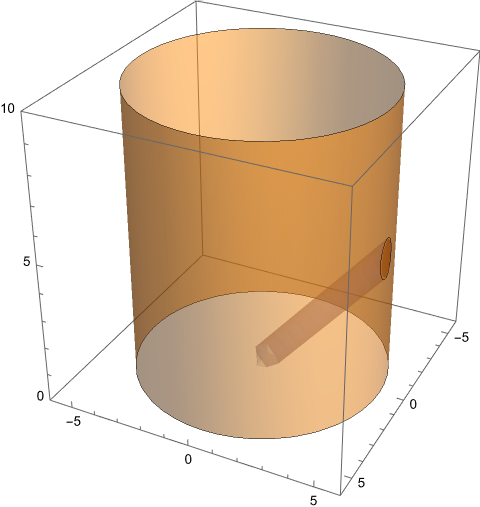
The (inspired) solution by @aardvark2012 to this original question: Transform a RegionFunction in ContourPlot3D worked well until an update appears to have changed the expected behavior (some time since ~2017):
If you specify PlotPoints -> 10 you still get the expected result:
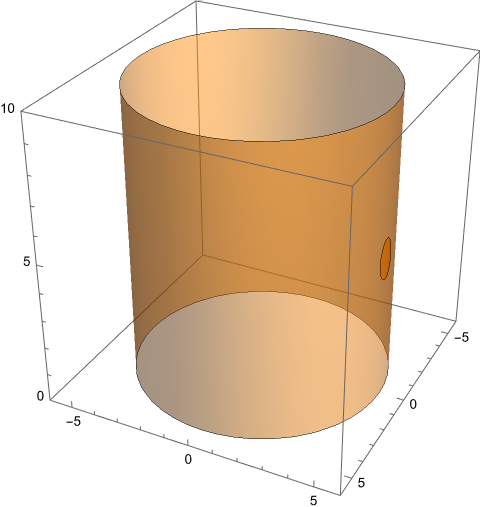
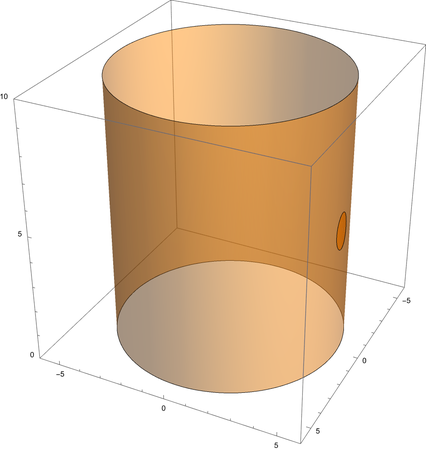
If you specify PlotPoints -> 25 you get the unexpected result:

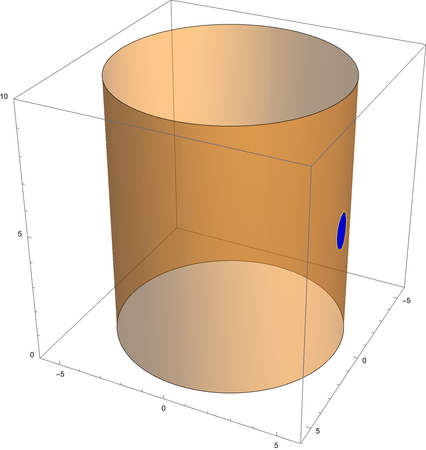
How do we get just the spot on the cylinder?
Although the original solution used PlotPoints -> 10, I have many similar constructions which previously give the expected result but now do not, so at that point @aardvark2012's solution was a general solution.
Here's @aardvark2012's solution from the above post: if you change PlotPoints -> 10 to PlotPoints -> 25 you get the unexpected result above. I needed to increase PlotPoints as the outline for other similar constructions was too coarse.
With[{a = 0.5, b = 0.5, r = 5, l = 10, c = 50},
  Show[
    ContourPlot3D[
      x^2/r^2 + y^2/r^2 == 1, {x, -r, r}, {y, -r, r}, {z, 0, l},
      Mesh -> None, PerformanceGoal -> "Quality", PlotRange -> {{-r - 1, r + 1}, {-r - 1, r + 1}, {0, l}},
        PlotPoints -> 10, ContourStyle -> Opacity[0.5]],

    ContourPlot3D[
      x^2/r^2 + y^2/r^2 == 1, {x, -r, r}, {y, -r, r}, {z, 0, l},
      RegionFunction ->
        Function[{x, y, z},
          Evaluate@
            RegionMember[
            TransformedRegion[
              ImplicitRegion[(x/a)^2 + (y/b)^2 <= 1 + (z/c)^2, {{x, -r, r}, {y, -r, r}, {z, 0, l}}],
                RotationTransform[{{0, 0, 1}, {0, 1, 1}}]], {x, y, z}]],
      Mesh -> None, PerformanceGoal -> "Quality",
      PlotRange -> {{-r, r}, {-r, r}, {0, l}}, PlotPoints -> 10],

    ViewPoint -> {Pi, Pi/2, 2}]
]


