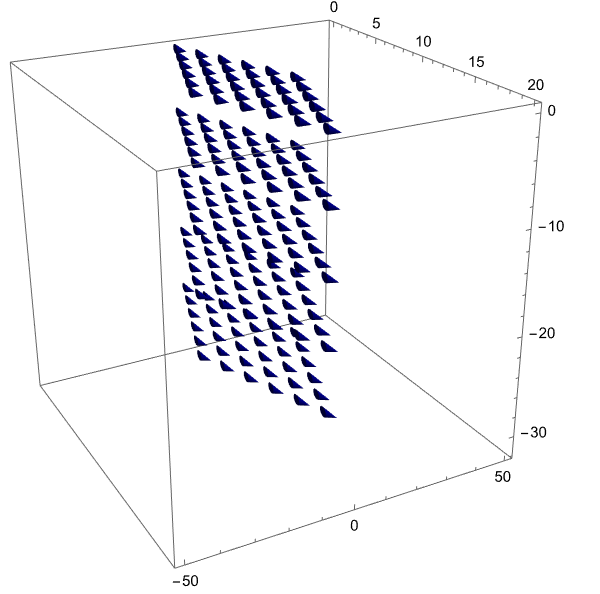
It's as simple as the title says. My code is:
b1 = 2 Pi/a {1/Sqrt[3], 1, 0};
b2 = 2 Pi/a {1/Sqrt[3], -1, 0};
b3 = -2 Pi/c {0, 0, 1};

KK[n1_, n2_, n3_] = n1 b1 + n2 b2 + n3 b3;

lista1 = Table[{KK[n1, n2, n3], b1}, {n1, 0, 5, 1}, {n2, 0, 5,
    1}, {n3, 0, 5, 1}];

reemp = {a -> 2, c -> 1};

l1 = lista1 /. reemp;
l2 = lista2 /. reemp;
l3 = lista3 /. reemp;

ListVectorPlot3D[l1, VectorPoints -> All]
I compare it whith the manual's ("Get Help" option) working example:
vectors = Table[{{x, y, z}, {y, x - x^3, z}}, {x, -1.5, 1.5, 0.2}, {y, -2, 2,0.2}, {z, -1, 1,0.1}];
ListVectorPlot3D[vectors];
but can't find any significant difference in terms of code. Also tried using the option "VectorPoints -> All", but with no avail. I read some past answers but found nothing i could use. The most similar question i could find is this 8-year-old wolfram's forum question
but there they don't really solve the problem. Maybe nowadays there's finally an answer!
EDIT: the idea is to have the vectors $b_i$ plotted at KK sites
Forgot to mention that i also tried this other implementation that does plot something, but not what i want...the vectors doesn't seem to be located at the points positions
n1max = 3 ; n2max = 3 ; n3max = 3;
pason1 = 1; pason2 = 1; pason3 = 1;

posiciones = Flatten[Table[KK[n1, n2, n3], {n1, 0, n1max, pason1}, {n2, 0, n2max,pason2}, {n3, 0, n3max, pason3}], 2];

lista1 = Table[b1, {n1, 0, n1max, pason1}, {n2, 0, n2max, pason2}, {n3, 0, n3max,pason3}];

reemp = {a -> 2, c -> 1};

l1 = lista1 /. reemp;
l2 = lista2 /. reemp;
l3 = lista3 /. reemp;

prom = Mean[{2 Pi/a, 2 Pi/c} /. reemp];

g1 = ListPointPlot3D[posiciones /. reemp];
gv1 = ListVectorPlot3D[l1,DataRange -> {{0, n1max Norm[b1]}, {0, n2max Norm[b2]}, {0,n3max Norm[b3]}} /. reemp, VectorScale -> Small];
Show[g1, gv1]
Also I'd like the arrows to start at the position dots and extend to the corresponding next dots... something like: o->o


ListVectorPlot3Dalso has dimensions{16, 21, 21, 2, 3}(you provide {{x, y, z}, {dx, dy, dz}}). $\endgroup$