6
$\begingroup$

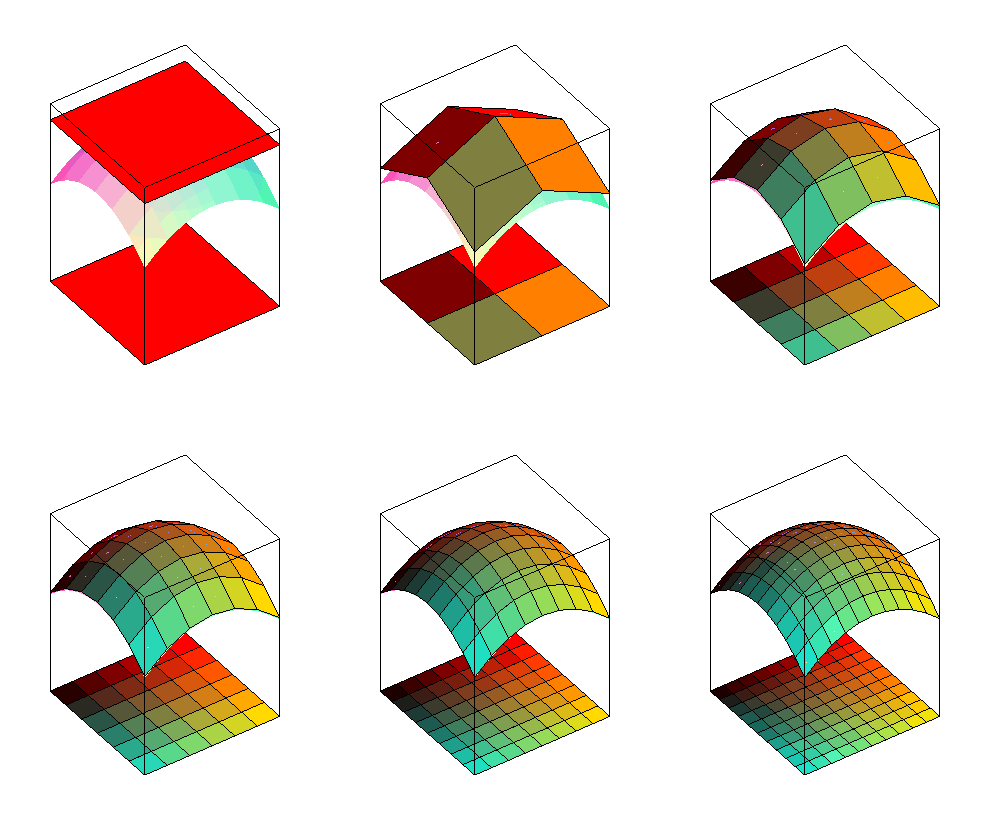
I want to reproduce the effect in the figure below, approximating a surface with tangent planes, enter image description here
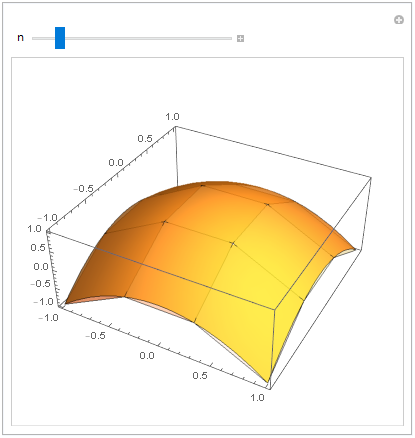
Now I can only use polygons to approximate inside the surface, although a bit similar but it's different. How should I draw each polygon tangent to the surface?

Manipulate[Module[{f, d},
  f = Function[{x, y}, 1 - x^2 - y^2];
  d = 2/n;
  Show[Plot3D[f[x, y], {x, -1, 1}, {y, -1, 1}, 
    PerformanceGoal -> "Quality", Mesh -> None, 
    PlotStyle -> Opacity[0.8]],
   Graphics3D[{
     Table[
      Polygon[{#, #2, f[#, #2]} & @@@ {{i, j}, {d + i, j}, {d + i, 
          d + j}, {i, d + j}}], {i, -1, 1 - d, d}, {j, -1, 1 - d, d}]
     }, PlotRange -> 1]]
  ]
 , {n, 2, 10, 1}]

enter image description here

$\endgroup$
2
  • $\begingroup$ The animation is wrong.It is impossible to draw a connected piecewise surface tangent to the surface locally. $\endgroup$
    – cvgmt
    Commented Sep 5, 2022 at 15:17
  • $\begingroup$ Almost only Bezier surface can approximate by piecewise surface,but the animation still does not according to the defination of the area of surface. $\endgroup$
    – cvgmt
    Commented Sep 5, 2022 at 15:28

3 Answers 3

7
$\begingroup$

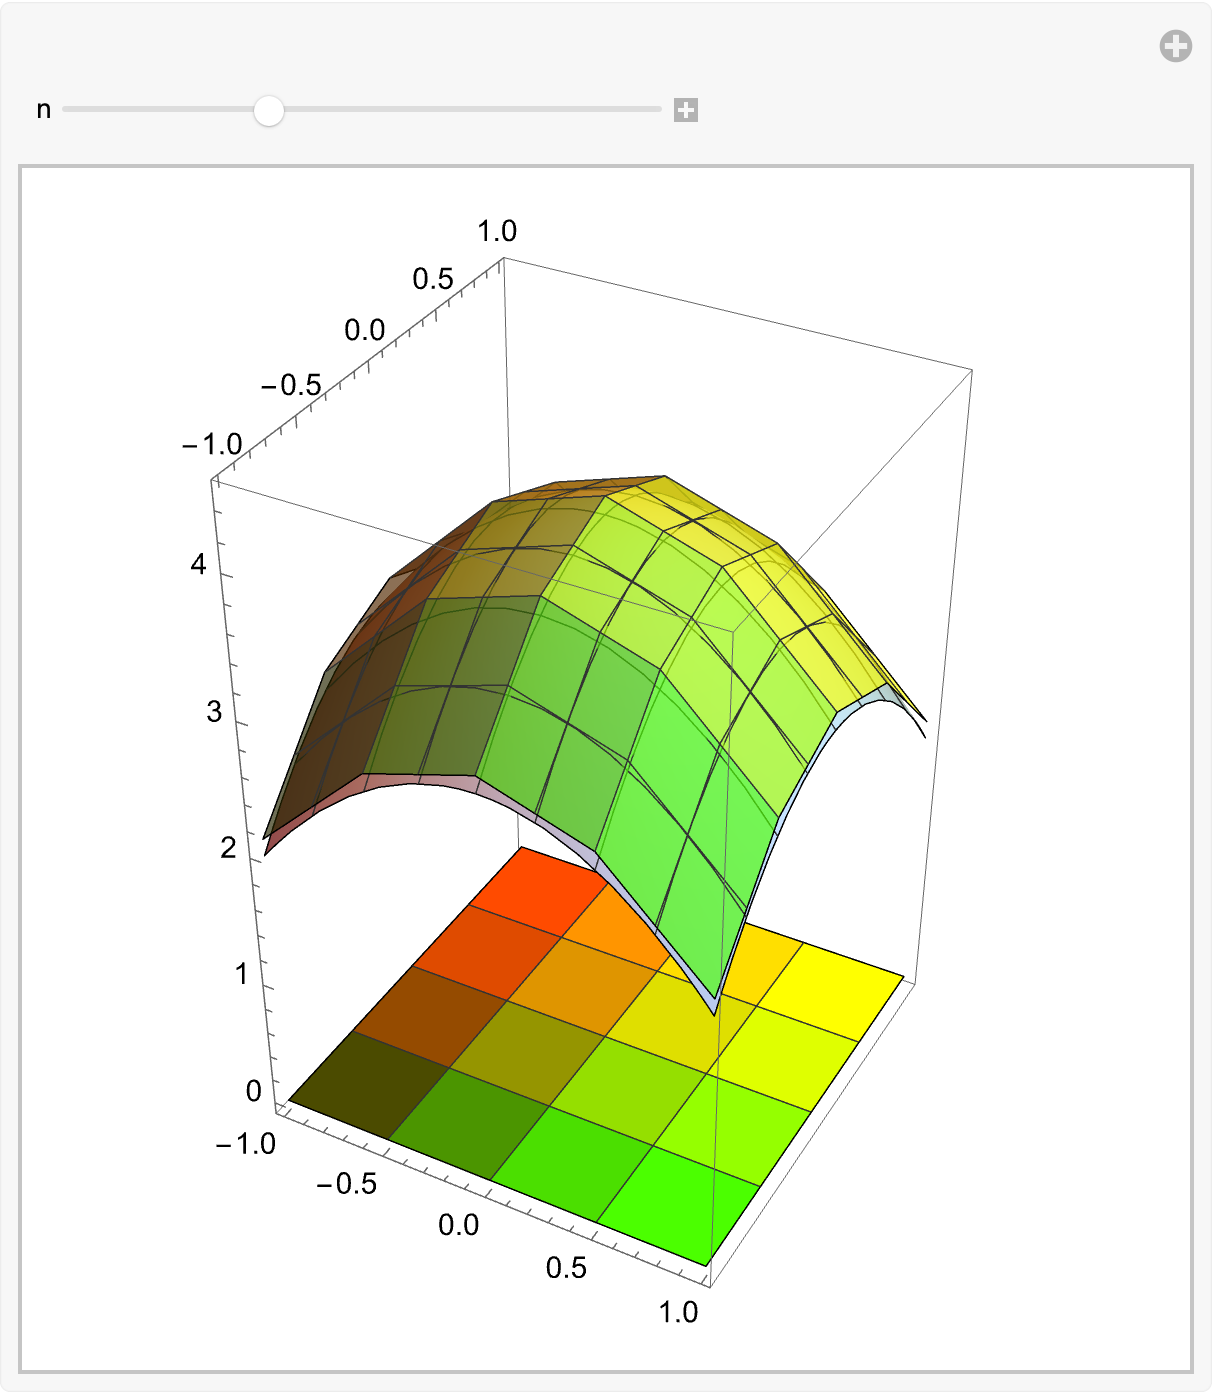
To answer @cvgmt's comment, I would point out this image/animation works because the surface is of the form $z=a-bx^2-by^2$. This implies the vertices of the tangent plane segments over squares coincide at the same height above the surface at every vertex.

Manipulate[
 Show[
  
  ListPlot3D[
   Table[4 - x^2 - y^2 + 2/n^2, {x, -1, 1, 2/n}, {y, -1, 1, 2/n}],
   NormalsFunction -> None, Mesh -> 2 n - 1, 
   MeshShading -> 
    Flatten[Table[{{1, 1}, {1, 1}} RGBColor[j/n, k/n, 0, 2/3], {j, 
       n}, {k, n}], {{1, 3}, {2, 4}}], 
   DataRange -> {{-1, 1}, {-1, 1}}],
  
  Plot3D[4 - x^2 - y^2, {x, -1, 1}, {y, -1, 1}, 
   PlotStyle -> LightBlue, Mesh -> 2 n - 1],
  
  Plot3D[0, {x, -1, 1}, {y, -1, 1},
   Mesh -> Max[n - 1, 1], 
   MeshShading -> Table[RGBColor[j/n, k/n, 0], {j, n}, {k, n}], 
   PlotStyle -> RGBColor[1/2, 1/2, 0]],
  BoxRatios -> {1, 1, 3/2}, PlotRange -> {{-1, 1}, {-1, 1}, {0, 4.5}},
   Lighting -> "Neutral"
  ],
 
 {n, 1, 10, 1}
 ]
$\endgroup$
1
  • 2
    $\begingroup$ (+1)Parabolic curves or surfaces are good enough! $\endgroup$
    – cvgmt
    Commented Sep 6, 2022 at 0:08
7
$\begingroup$

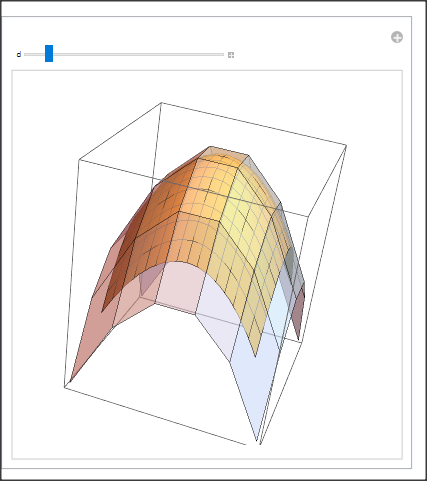
To get an approximation to your surface we first need the function and its gradient;

f[{x_, y_}] = (1 - x^2 - y^2);
grad[{x_, y_}] = Grad[f[{x, y}], {x, y}];

Then we create a 2D grid of points {x,y}, where the tangent planes will touch the surface:

centers = Flatten[Table[{x, y}, {x, -1, 1, 1/d}, {y, -1, 1, 1/d}], 1];

For this 2D centers we define a function, that takes a 2D center and calculates the 2D coordinates of the four 2D vertices of the tangent plane polygons:

vertices[cen_] := 
  Append[cen + #, f[cen] + grad[cen] . # ] & /@ ( 
    1/(2 d) {{-1, -1}, {1, -1}, {1, 1}, {-1, 1}});

With this we can calculate the 3D vertices of the tangent plane polygon:

tan = vertices /@ centers;

Finally we draw the tangent plane together with the surface and packe everything into a Manipulate:

f[{x_, y_}] = (1 - x^2 - y^2);
grad[{x_, y_}] = Grad[f[{x, y}], {x, y}];

Manipulate[
 vertices[cen_] := 
  Append[cen + #, f[cen] + grad[cen] . # ] & /@ ( 
    1/(2 d) {{-1, -1}, {1, -1}, {1, 1}, {-1, 1}});
 centers = Flatten[Table[{x, y}, {x, -1, 1, 1/d}, {y, -1, 1, 1/d}], 1];
 tan = vertices /@ centers;
 
 Show[Graphics3D[{Opacity[0.6], Polygon /@ tan}], 
  Plot3D[f[{x, y}], {x, -1, 1}, {y, -1, 1}]]
 , {d, 1, 10, 1}, TrackedSymbols :> {d}]

enter image description here

$\endgroup$
5
$\begingroup$
  • Thanks @Michael E2 point out that quadratic paraboloid work. Here we use the definiton of differential of function to get the tangent plane for 2-variables function,see df as in the code.

  • And we treat the general form of quadratic paraboloid f[x,y]=a-b*x^2-c*y^2; or any other differentiable function f[x,y]=Sin[x + Cos[y]];.

Clear[f, df, plot, data];
f[x_, y_] = 
  RandomReal[{0, 3}] - RandomReal[{2, 3}] x^2 - RandomReal[{2, 3}] y^2;
(*f[x_,y_]=1-x^2-y^2; *)
df[f_, {x0_, y0_}] = 
  f[x0, y0] + {Derivative[1, 0][f][x0, y0], 
      Derivative[0, 1][f][x0, y0]} . (## - {x0, y0}) &;
plot = Plot3D[f[x, y], {x, -1, 1}, {y, -1, 1}, Mesh -> None];

data = Table[
   regs = MeshPrimitives[
     ArrayMesh[ConstantArray[1, {n, n}], 
      DataRange -> {{-1, 1}, {-1, 1}}], 2];
   Graphics3D[{Table[({x, y} |-> {x, y, 
           df[f, RegionCentroid@reg]@{x, y}}) @@@ 
        MeshCoordinates[reg] // Polygon, {reg, regs}], plot[[1]], 
     RegionProduct[#, Point[{f[1, 1]}]] & /@ regs}, BoxRatios -> 1, 
    Boxed -> False], {n, 1, 10}];
ListAnimate[data, AnimationRunning -> True, 
 ControlPlacement -> Bottom]
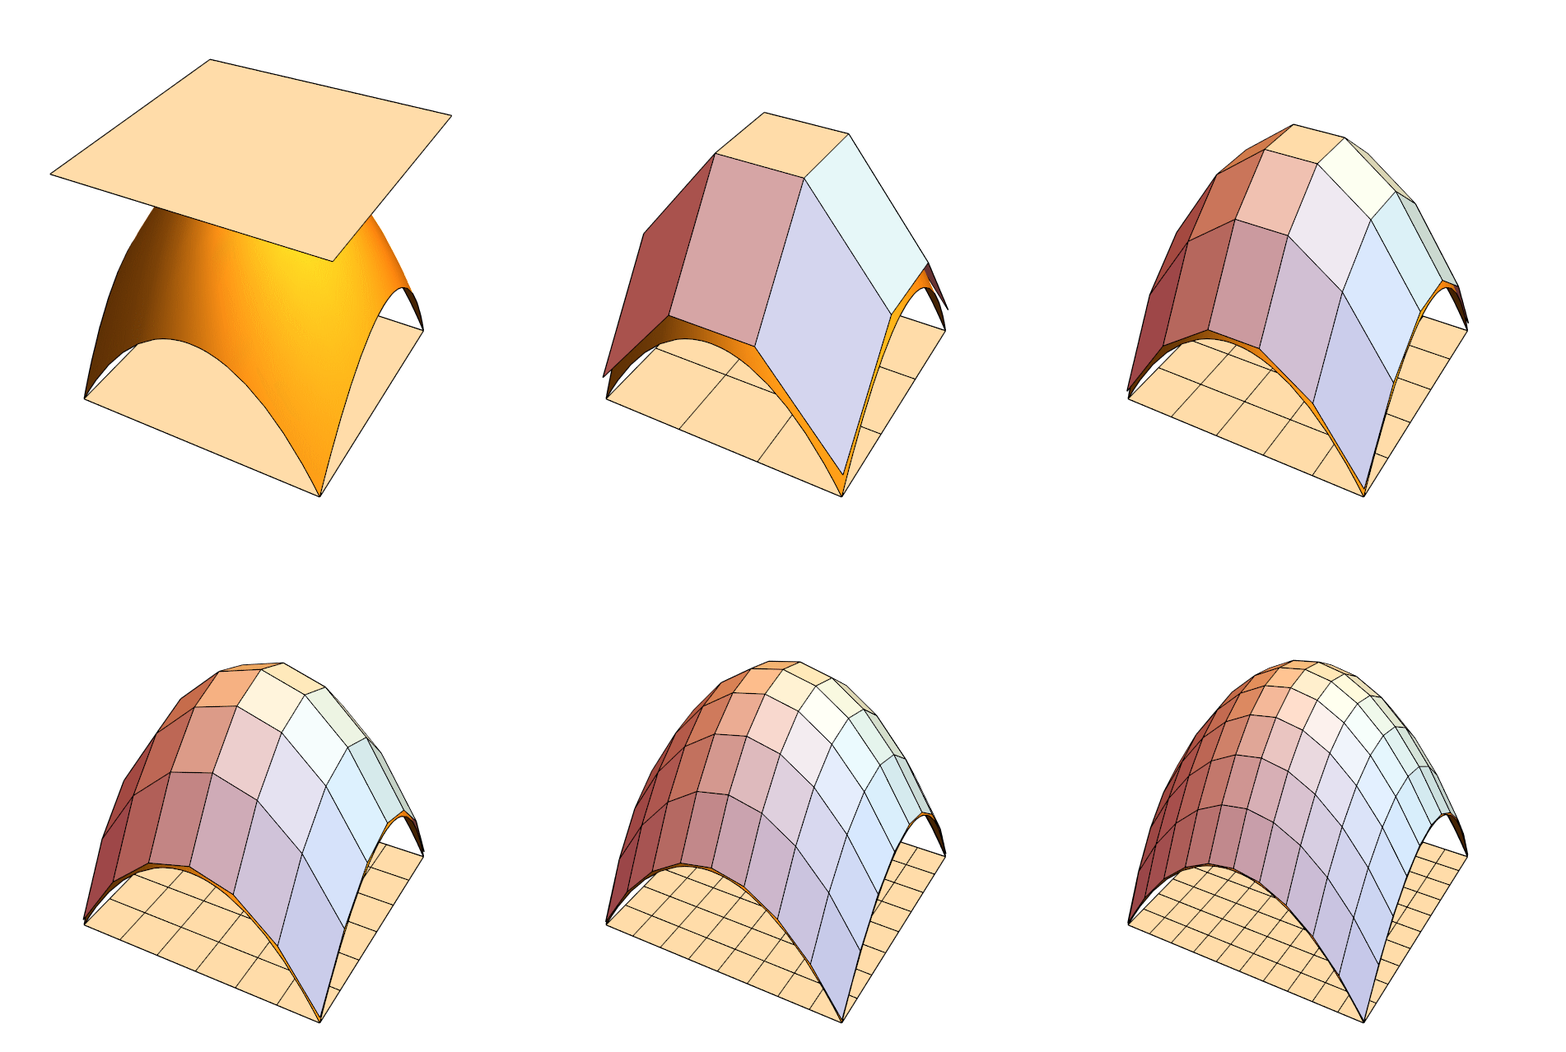
enter image description here

TODO

I want to replace RegionCentroid@reg to RandomPoint@reg in the code to get some general definition of the area of surface,but now it seems need to be revided later since I doesn't know whether we need to use orthogonal projection to project the pieces of the surface to the tangent plane and how?

Clear[f, df, plot, data];
f[x_, y_] = 
  RandomReal[{0, 3}] - RandomReal[{2, 3}] x^2 - RandomReal[{2, 3}] y^2;
(*f[x_,y_]=1-x^2-y^2;*)
df[f_, {x0_, y0_}] = 
  f[x0, y0] + {Derivative[1, 0][f][x0, y0], 
      Derivative[0, 1][f][x0, y0]} . (## - {x0, y0}) &;
plot = Plot3D[f[x, y], {x, -1, 1}, {y, -1, 1}, Mesh -> None, 
   PlotPoints -> 80, MaxRecursion -> 4];

data = Table[
   regs = 
    MeshPrimitives[
     ArrayMesh[ConstantArray[1, {n, n}], 
      DataRange -> {{-1, 1}, {-1, 1}}], 2];
   pts = RandomPoint /@ regs;
   Graphics3D[{Table[({x, y} |-> {x, y, 
           Evaluate@df[f, pts[[i]]]@{x, y}}) @@@ 
        MeshCoordinates[regs[[i]]] // Polygon, {i, Length@regs}], 
     plot[[1]], RegionProduct[#, Point[{f[1, 1]}]] & /@ regs}, 
    BoxRatios -> 1, Boxed -> False], {n, 1, 10}];
ListAnimate[data, AnimationRunning -> True, ControlPlacement -> Bottom]
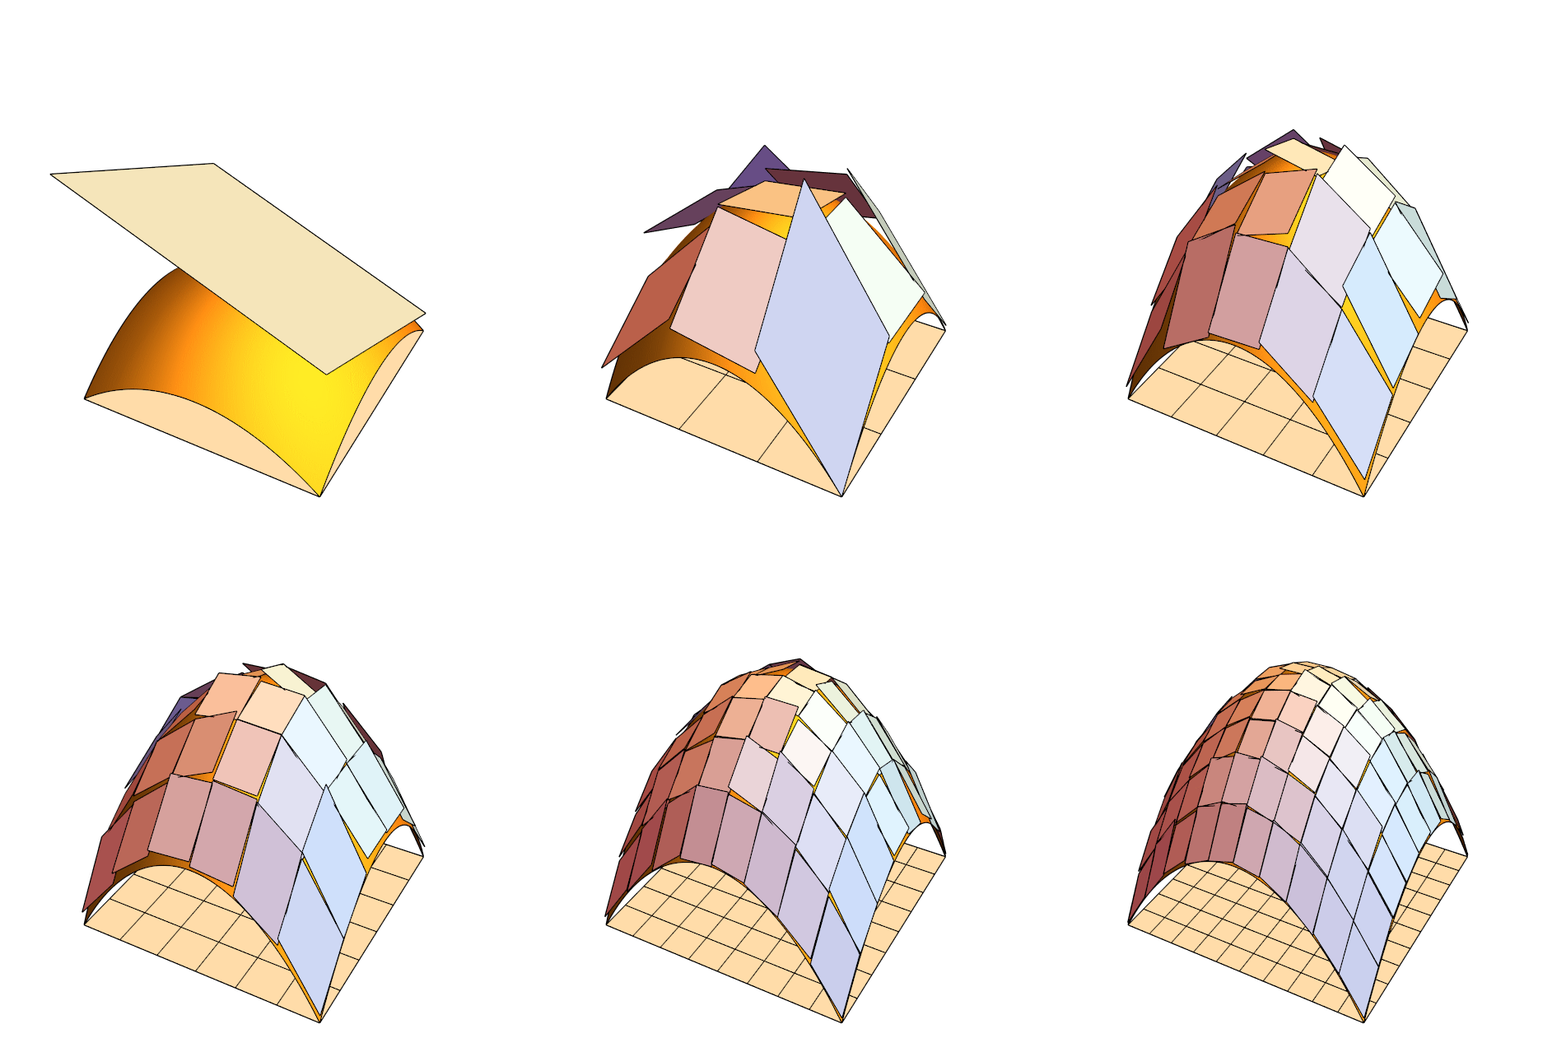
enter image description here

Test arbitrary function

  • Tangent points are RegionCentroid.
Clear[f, df, plot, regs];
f[x_, y_] = Sin[x*y];
df[f_, {x0_, y0_}] = 
  f[x0, y0] + {Derivative[1, 0][f][x0, y0], 
      Derivative[0, 1][f][x0, y0]} . (## - {x0, y0}) &;
plot = Plot3D[f[x, y], {x, 0, 3}, {y, 0, 3}, PlotPoints -> 60, 
   MaxRecursion -> 4, Mesh -> None, PlotStyle -> Green];
n = 25;
regs = MeshPrimitives[
   ArrayMesh[ConstantArray[1, {n, n}], DataRange -> {{0, 3}, {0, 3}}],
    2];
Graphics3D[{Opacity[.5], 
  Table[({x, y} |-> {x, y, df[f, RegionCentroid@reg]@{x, y}}) @@@ 
     MeshCoordinates[reg] // Polygon, {reg, regs}], plot[[1]]}, 
 BoxRatios -> 1, Boxed -> False]
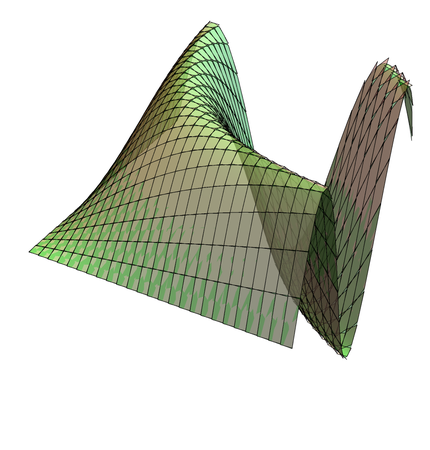
enter image description here

  • Tangent Points are bottom left.
Clear[f, df, plot, n, regs];
f[x_, y_] = Sin[x*y];
df[f_, {x0_, y0_}][{x_, y_}] = 
  f[x0, y0] + {Derivative[1, 0][f][x0, y0], 
     Derivative[0, 1][f][x0, y0]} . ({x, y} - {x0, y0});
plot = Plot3D[f[x, y], {x, 0, 3}, {y, 0, 3}, PlotPoints -> 60, 
   MaxRecursion -> 4, Mesh -> None, PlotStyle -> Darker@Cyan];
n = 25;
regs = MeshPrimitives[
   ArrayMesh[ConstantArray[1, {n, n}], DataRange -> {{0, 3}, {0, 3}}],
    2];
Graphics3D[{Opacity[.8], 
  Table[({x, y} |-> {x, y, 
        df[f, First@*Transpose@*RegionBounds@reg]@{x, y}}) @@@ 
     MeshCoordinates[reg] // Polygon, {reg, regs}], plot[[1]]}, 
 BoxRatios -> 1, Boxed -> False]
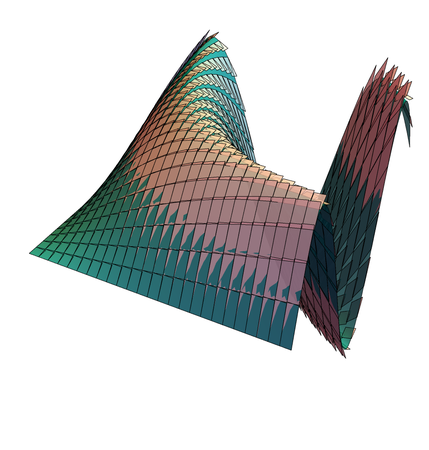
enter image description here

$\endgroup$

Your Answer

By clicking “Post Your Answer”, you agree to our terms of service and acknowledge you have read our privacy policy.

Not the answer you're looking for? Browse other questions tagged or ask your own question.