0
$\begingroup$

The Problem

I am trying to split a data set into multiple parts - thanks to help in the past, this has been done before into 2 parts, but I would like to extend this functionality into multiple parts (though the example uses 3). I suspect my problem is how I've used SplitBy.

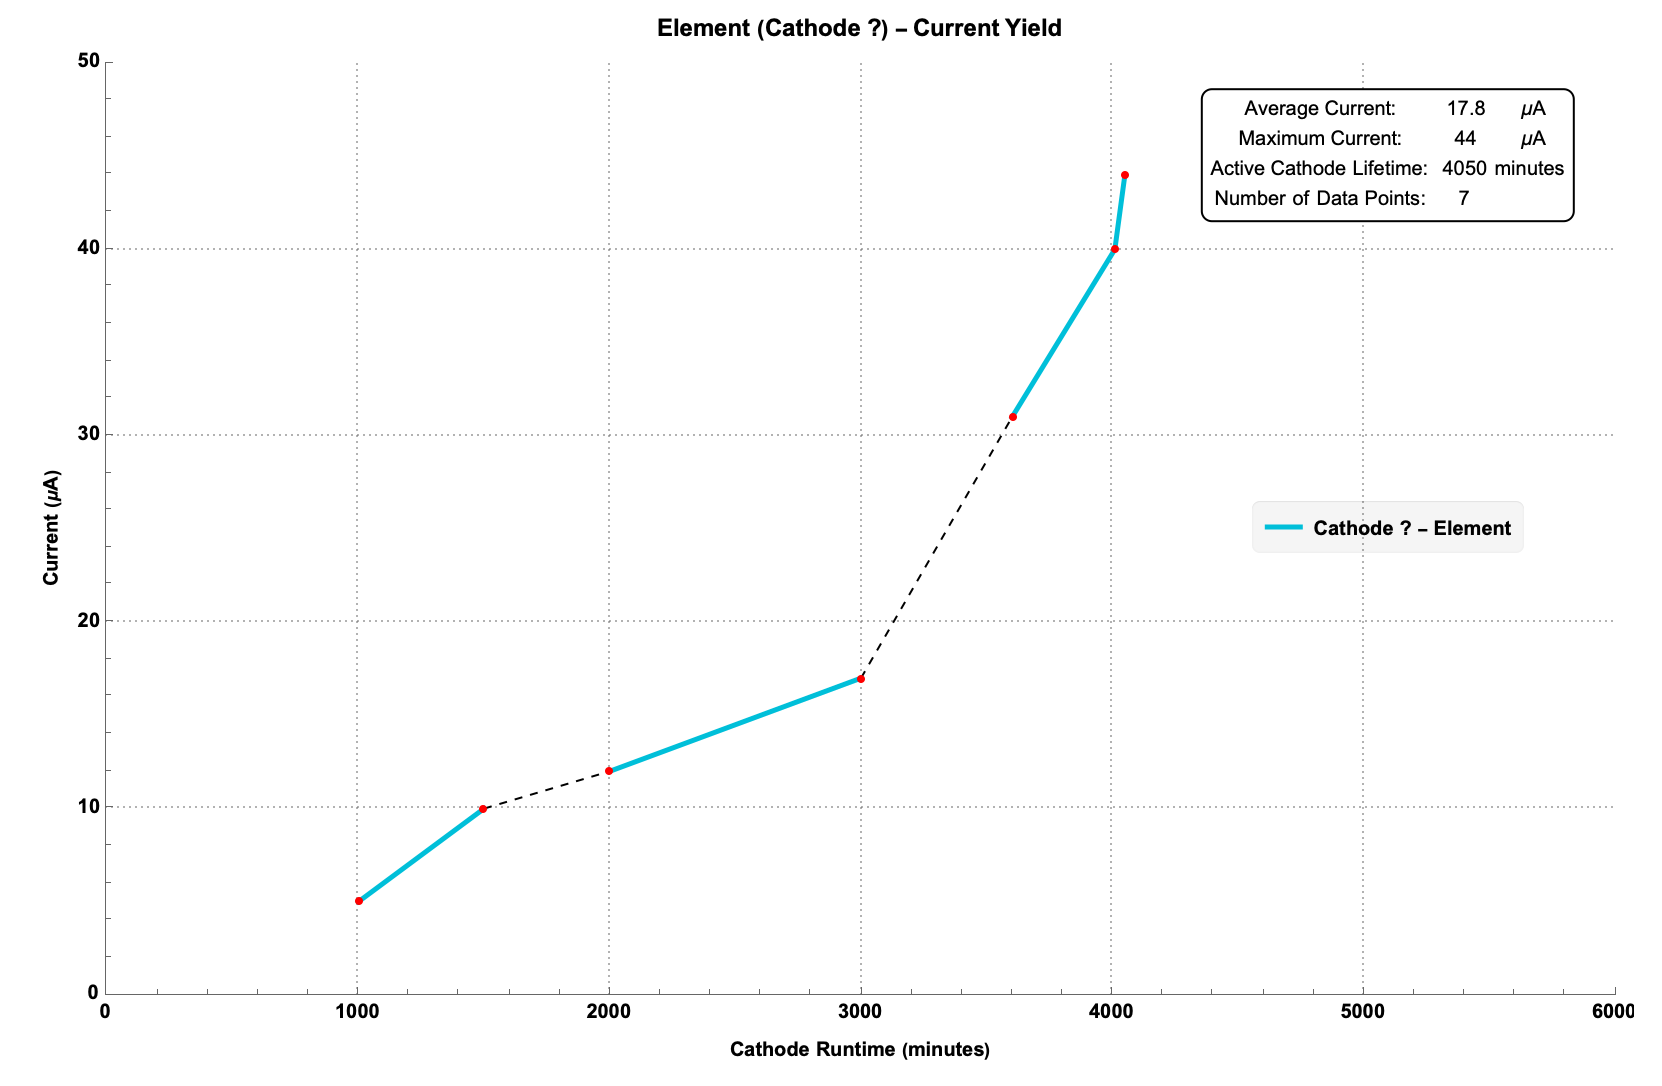
Here I am intending to split the graph into multiple parts and draw a dashed line on the graph joining the last and first point of each part. And be able to still calculate average etc.

Additionally the average current figure seems to display as a fraction rather than a decimal - I tried NumberForm to fix it but it made no change.

The Code

dataSet = {{1000, 5}, {1500, 10}, {2000, 12}, {3000, 17}, {3601, 
    31}, {4010, 40}, 4050, 44};

{set[1], set[2], set[3]} = 
  SplitBy[dataSet, #[[1]] < 1850 & , #[[2]] > 1850 & < 
     3200 &, #[[3]] > 3200 &];
avgCurrent = 
  Integrate[
    Interpolation[dataSet, InterpolationOrder -> 1][x], {x, 
     dataSet[[1, 1]], dataSet[[-1, 1]]}]/(Subtract @@ 
     dataSet[[{-1, 1}, 1]]);
maxCurrent = MaximalBy[dataSet, Last][[1, 2]];
noPoints = Length[dataSet];
lifeTime = dataSet[[-1, 1]];
ListLinePlot[{set[1], set[2], set[3]}, 
 PlotRange -> {{0, 6000}, {0, 25}}, 
 PlotStyle -> {Directive[RGBColor[0., 0.75, 0.85], 
    AbsoluteThickness[2.5]]}, PlotTheme -> "Detailed", 
 Epilog -> {{Dashed, Line[{{1500, 10`}, {2000, 12`}}]}, {Dashed, 
    Line[{{3000, 17`}, {3601, 31`}}]}, {Red, AbsolutePointSize[4], 
    Point[dataSet]}, 
   Inset[Framed[
     Grid[{{"Average Current: ", avgCurrent, 
        " \[Mu]A"}, {"Maximum Current: ", maxCurrent, 
        " \[Mu]A"}, {"Active Cathode Lifetime: ", lifeTime, 
        "minutes"}, {"Number of Data Points: ", noPoints}}], 
     Background -> White, RoundingRadius -> 5], Scaled[{.85, .9}]]}, 
 PlotLabel -> "Element (Cathode ?) - Current Yield", 
 PlotLegends -> 
  Placed[LineLegend[{"Cathode ? - Element"}, 
    LegendFunction -> "Panel"], {0.85, 0.5}], 
 LabelStyle -> {Black, Bold}, Frame -> {{True, False}, {True, False}},
  FrameLabel -> {"Cathode Runtime (minutes)", "Current (\[Mu]A)"}, 
 ImageSize -> {850, 550}, InterpolationOrder -> 1]

The Output (The Relevant Bit - I think)

A series of errors, leading with...

Part::partw: Part 2 of #1 does not exist. SplitBy::argt: SplitBy called with 3 arguments; 1 or 2 arguments are expected.

Thanks in advance for any help

$\endgroup$
4
  • 1
    $\begingroup$ Can you explain how you want to spit the data? $\endgroup$
    – H. Zhou
    Commented Aug 9, 2022 at 9:09
  • $\begingroup$ Look up "SplitBy" in the help you are using it the wrong way. $\endgroup$ Commented Aug 9, 2022 at 9:29
  • $\begingroup$ I would like to split the data so that each set[] is joined with a solid line on the graph, and a dotted line between sets. (As due to it being a new day, it represents an artificial increase) $\endgroup$
    – Epideme
    Commented Aug 9, 2022 at 12:52
  • $\begingroup$ I have looked at the 'SplitBy' page but am still unsure what I'm doing wrong. I have admittedly always found it hard to understand the documentation. I have changed the code based on what I thought the documentation is expecting, but no luck $\endgroup$
    – Epideme
    Commented Aug 9, 2022 at 13:04

1 Answer 1

1
$\begingroup$

Firstly, there is a typo in the definition of dataSet, that the last two elements should be curl-bracketed:

dataSet = {{1000, 5}, {1500, 10}, {2000, 12}, {3000, 17}, {3601, 
    31}, {4010, 40}, {4050, 44}};

Then I spit by hand:

set[1] = Cases[dataSet, {x_, y_} /; x < 1850];
set[2] = Cases[dataSet, {x_, y_} /; 1850 < x < 3200];
set[3] = Cases[dataSet, {x_, y_} /; x > 3200];

To get a decimal form of avgCurrent I use N in combination with SetPrecision to obtain the needed digital points:

avgCurrent = 
 Integrate[
   Interpolation[dataSet, InterpolationOrder -> 1][x], {x, 
    dataSet[[1, 1]], dataSet[[-1, 1]]}]/(Subtract @@ 
    dataSet[[{-1, 1}, 1]])//N//SetPrecision[#,3]&
(* 17.8 *)

Finally I changed the PlotRange to {{0, 6000}, {0, 50}} because the maximal y value in dataSet is 44.

The rest of the code works for me and I got this plot: enter image description here

$\endgroup$
1
  • $\begingroup$ Thank you, that's perfect. $\endgroup$
    – Epideme
    Commented Aug 9, 2022 at 14:10

Your Answer

By clicking “Post Your Answer”, you agree to our terms of service and acknowledge you have read our privacy policy.

Not the answer you're looking for? Browse other questions tagged or ask your own question.