First, let's define the array of random sets:
args = RandomReal[{0, 2}, {50000, 4}];
I've limited the coordinates up to 2 but it can be any.
Let's take from args all the sets that fit the desired constrains are:
cnsts = Select[args, Norm[#[[1 ;; 3]]] <= 1 &];
The function is:
f = #[[1]]^2 + #[[1]] #[[2]] + #[[2]] #[[3]] + #[[3]]^3 + #[[4]]^2 &;
An array of values {Norm@cnsts[[i,1;;3]],f@cnsts[[i]]} is:
res = Table[{Norm[cnsts[[i, 1 ;; 3]]], f@cnsts[[i]]},
            {i, 1, Length@cnsts}];
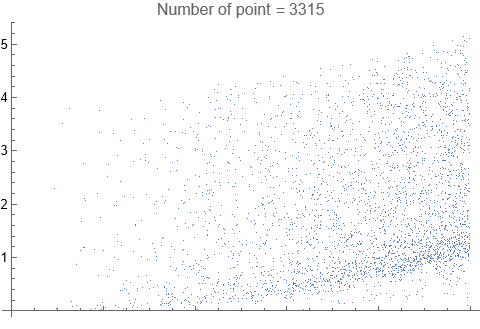
And the plot is:
ListPlot[res, PlotLabel -> "Number of point = " <> ToString@Length@cnsts]

There 3315 random elements of args fit with your constrains.
P.S. I don't understand why the bottom Axis appeared without Ticks but this is in range {0,1} according the constrains


ais not really possible, sinceacould be anywhere from 0 to infinity). If you care about the randomness of the chosen points, you'll have to decide on a distribution forathat is well-defined. $\endgroup$