I have two sets of data :
data1 = {{0.36, 0.076}, {0.361, 0.075}, {0.362, 0.074}, {0.363,
  0.072}, {0.364, 0.071}, {0.365, 0.069}, {0.366, 0.068}, {0.367,
  0.066}, {0.368, 0.065}, {0.369, 0.063}, {0.37, 0.062}, {0.371,
  0.06}, {0.372, 0.059}, {0.373, 0.057}, {0.374, 0.055}, {0.375,
  0.053}, {0.376, 0.051}, {0.377, 0.049}, {0.378, 0.047}, {0.379,
  0.045}, {0.38, 0.044}, {0.381, 0.042}, {0.382, 0.04}, {0.383,
  0.038}, {0.384, 0.036}, {0.385, 0.034}, {0.386, 0.031}, {0.387,
  0.029}, {0.388, 0.026}, {0.389, 0.022}, {0.39, 0.018}, {0.391,
  0.012}, {0.392, 0.002}}
and
data2 = {{0.36, 0.076}, {0.361, 0.075}, {0.362, 0.074}, {0.363,
  0.072}, {0.364, 0.071}, {0.365, 0.069}, {0.366, 0.068}, {0.367,
  0.066}, {0.368, 0.065}, {0.369, 0.064}, {0.37, 0.062}, {0.371,
  0.061}, {0.372, 0.059}, {0.373, 0.058}, {0.374, 0.056}, {0.375,
  0.055}, {0.376, 0.054}, {0.377, 0.052}, {0.378, 0.051}, {0.379,
  0.049}, {0.38, 0.048}, {0.381, 0.046}, {0.382, 0.045}, {0.383,
  0.043}, {0.384, 0.041}, {0.385, 0.04}, {0.386, 0.038}, {0.387,
  0.037}, {0.388, 0.036}, {0.389, 0.034}, {0.39, 0.033}, {0.391,
  0.031}, {0.392, 0.029}, {0.393, 0.027}, {0.394, 0.025}, {0.395,
  0.023}, {0.396, 0.021}, {0.397, 0.018}, {0.398, 0.014}, {0.399,
  0.009}, {0.4, 0.002}}
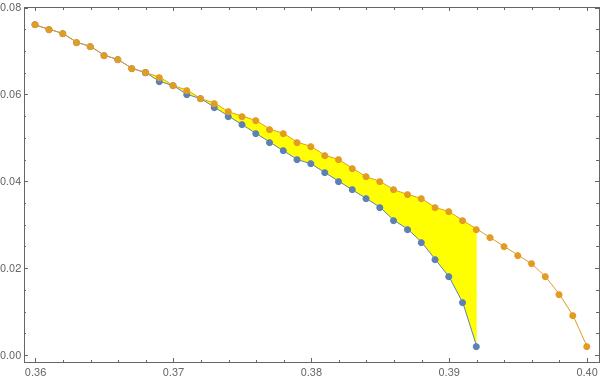
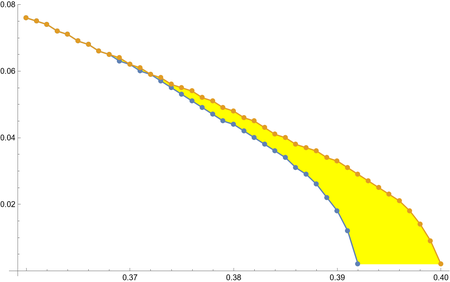
I am going to make a list plot of these two sets of data and fill the area between them. I followed the instruction here :Filling between two listplots, but i could not get the result I wanted. In what I get from listplot only a part of area is filled. How can I fill the remaining part?
By the way, the length of two sets of data is different


