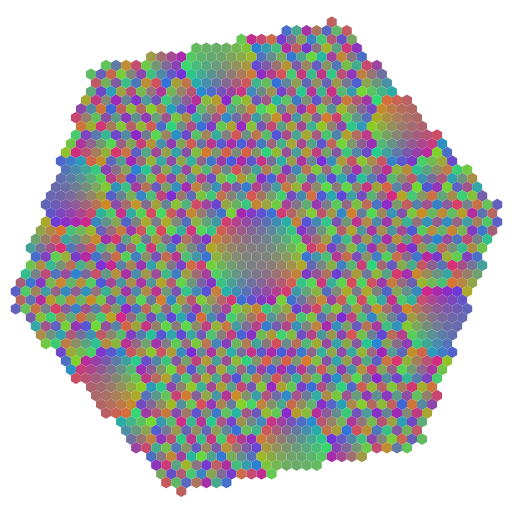
I'm trying to plot a function taking discrete values on hexagonal lattice.
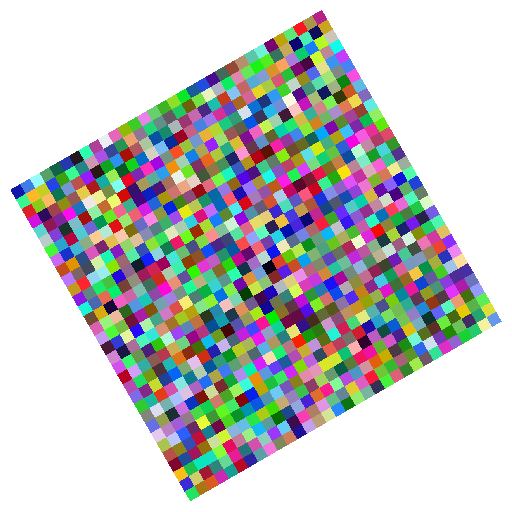
However, there are visible white seams between hexagonal pixels. As a comparison, the built-in Raster primitive does not produce seams, even if rotated.
Image[Graphics@GeometricTransformation[
  Raster@RandomReal[1., {32, 32, 3}],RotationMatrix[2 \[Pi]/3]
  ],
  ImageSize -> {512, 512}]
Here's the code I used to produce hex-plot:
(*algebraic definitions*)

RandomPrime3np1[range : {_Integer, _Integer}] := Block[{p},
  Do[p = RandomPrime[range];
   If[Mod[p, 3] == 1, Return[p]], {\[Infinity]}]
  ]
EisensteinFactorizableQ[q_Integer] :=
 PrimePowerQ[q] && Mod[q, 3] == 1
EisensteinMat = {{1, 0}, {-1, Sqrt[3]}/
    2};(*point_in_hex == point_in_rect.EisensteinMat*)

EisensteinNorm[{x_, y_}] := (x^2 - x y + y^2)
EisensteinPeriod[q_Integer /; EisensteinFactorizableQ[q]] :=
 Block[{m, n}, {m, n} /.
   FindInstance[{m^2 - m n + n^2 == q, 0 < m < q, 0 < n < q,
      m < n}, {m, n}, Integers][[1]]]
HexReduce[{x0_, y0_}] := Block[{x = x0, y = y0},
  With[{s = Floor[(x - y + 1)/2]}, x -= s; y += s;];
  With[{s = 3*Floor[(x + y + 1)/6]}, x -= s; y -= s];
  If[Min[x, y] > 2, x -= 3; y -= 3
   , If[Max[x, y] > 1, If[x > y, x -= 2; y -= 1, x -= 1; y -= 2]]
   ]; {x, y}]
EisensteinReduce[xy : {_Integer, _Integer}, q_Integer] :=
 With[{mat1 = {{1, 0}, {-1, Sqrt[3]}/2}}, With[
   {ep = EisensteinPeriod[q] .
       mat1 . {{Sqrt[3], -1}, {1, Sqrt[3]}}/(2 Sqrt[3])},
   With[{mat = mat1 . Inverse@{ep, RotationMatrix[2 \[Pi]/3] . ep}},
    Simplify[HexReduce[xy . mat] . Inverse[mat]]
    ]]]
EisensteinReduce[n_Integer, q_Integer] := EisensteinReduce[{n, 0}, p]
EisensteinRange[q_Integer /; EisensteinFactorizableQ[q]] :=
 Table[EisensteinReduce[i, q], {i, 0, q - 1}]

(*plot function over F_p on hexagonal lattice*)

p = RandomPrime3np1[{1, 2}*1000];
pts = EisensteinRange[p];
hexPts = {{2, 1}, {1, 2}, {-1, 1}, {-2, -1}, {-1, -2}, {1, -1}};
edgePts =
  DeleteDuplicates[Flatten[Outer[Plus, pts*3, hexPts, 1], 1]];
edgePts2Idx =
  Association @@ MapThread[Rule, {edgePts, Range@Length@edgePts}];
faceList = Table[With[{pt3 = 3*pt},
    Table[edgePts2Idx[pt3 + ipt], {ipt, hexPts}]], {pt, pts}];
colorList =
  With[{ep =
     EisensteinPeriod[p] . EisensteinMat . RotationMatrix[\[Pi]/6]*
      Sqrt[1/3]},
   With[{tmat =
      N[(1/2)*EisensteinMat . Inverse[{ep, ep . {{0, 1}, {-1, 0}}}] .
         Normalize /@ {{-1, 1, 0}, {-1, -1, 2}}]},
    (# + {1, 1, 1}/2) & /@ (pts . tmat)]];
fnList = Table[Mod[i^2, p], {i, 0, p - 1}];
Graphics[GeometricTransformation[#, Transpose@EisensteinMat] &@
  GraphicsComplex[
   edgePts,
   Flatten[MapThread[{RGBColor @@ #1, Polygon@#2} &, {colorList[[
       fnList + 1]], faceList}]]
   ]]
How do I remove seams between hex-pixels?
Some backgrounds:
Let prime number $p = 3n + 1 (n \in \mathbb{Z})$, let $\mathbb{Z}[\omega]$ be ring of eisenstein integers where $\omega = e^{\frac{2 \pi i}{3}}$. There exists $p_{\omega} \in \mathbb{Z}[\omega]$ where $|p_{\omega}|^2 = p$. The field $\mathbb{Z}[\omega]/p_{\omega} \mathbb{Z}[\omega]$ is isomorphic to $\mathbb{F}_p$. Hence it's possible to "embed" elements of $\mathbb{F}_p$ into hexagonal lattice.
Let $y = f(x)$ where $x, y \in \mathbb{F}_p$. For each hex-pixel, its coordinate is hex-embedding of $x$ and its color is hex-embedding of $y$ placed into hex-slice of RGB unit cube.


