1
$\begingroup$

I use

Clear["Global`*"];
(*=== 数据点  ===*)
bmiData = {17.53231562, 15.53238528, 17.26137457, 15.6088015, 
   15.20589021, 14.51292182, 14.75645275, 13.83305466, 15.69560048, 
   16.86902697, 18.0721242, 15.14403292, 17.44614778, 13.850415510, 
   18.32280354, 20.1631851, 18.59012493, 17.45527841, 18.58163511, 
   14.55731214, 15.40417624, 15.18792708, 15.62461325, 15.22882797, 
   15.02163115, 21.45492911, 20.89541272, 18.38647653, 29.34474265, 
   21.08535689, 22.02071132, 16.52876307, 18.38228254, 22.14403633, 
   19.2399927, 22.82261329, 26.10290031, 20.6759324, 22.34966855, 
   24.02533886};
fhlData = {1750, 2000, 2750, 2500, 2750, 2000, 2750, 1500, 2500, 2250,
    3000, 1250, 2750, 1750, 2250, 1750, 2000, 2250, 2750, 2000, 1750, 
   2250, 2750, 2500, 2000, 2772, 3458, 2065, 4208, 4579, 5300, 2811, 
   2563, 4075, 3762, 4781, 3919, 4357, 3839, 3770};

(*=== 基函数 ===*)
basisfun[n_] := Table[x^i, {i, 0, n}]

(*=== 数据点点图  ===*)
bmiListPlt = 
  ListPlot[bmiData, PlotStyle -> {Red}, PlotMarkers -> "OpenMarkers"];
fhlListPlt = 
  ListPlot[fhlData, PlotStyle -> {Red}, PlotMarkers -> "OpenMarkers"];

(*=== 数据点拟合 ===*)
bmifit = Fit[bmiData, basisfun@7, x];
fhlfit = Fit[fhlData, basisfun@7, x];

(*=== 拟合图像 ===*)
bmiFitPlt = Plot[
   bmifit,
   {x, 0, Length@bmiData + 1},
   PlotRange -> All
   ];

fhlFitPlt = Plot[
   fhlfit,
   {x, 0, Length@fhlData + 1},
   PlotRange -> All
   ];

(*=== 多项式拟合拟合和点图 ===*)
bmishow = Show[bmiFitPlt, bmiListPlt]
fhlshow = Show[fhlFitPlt, fhlListPlt]

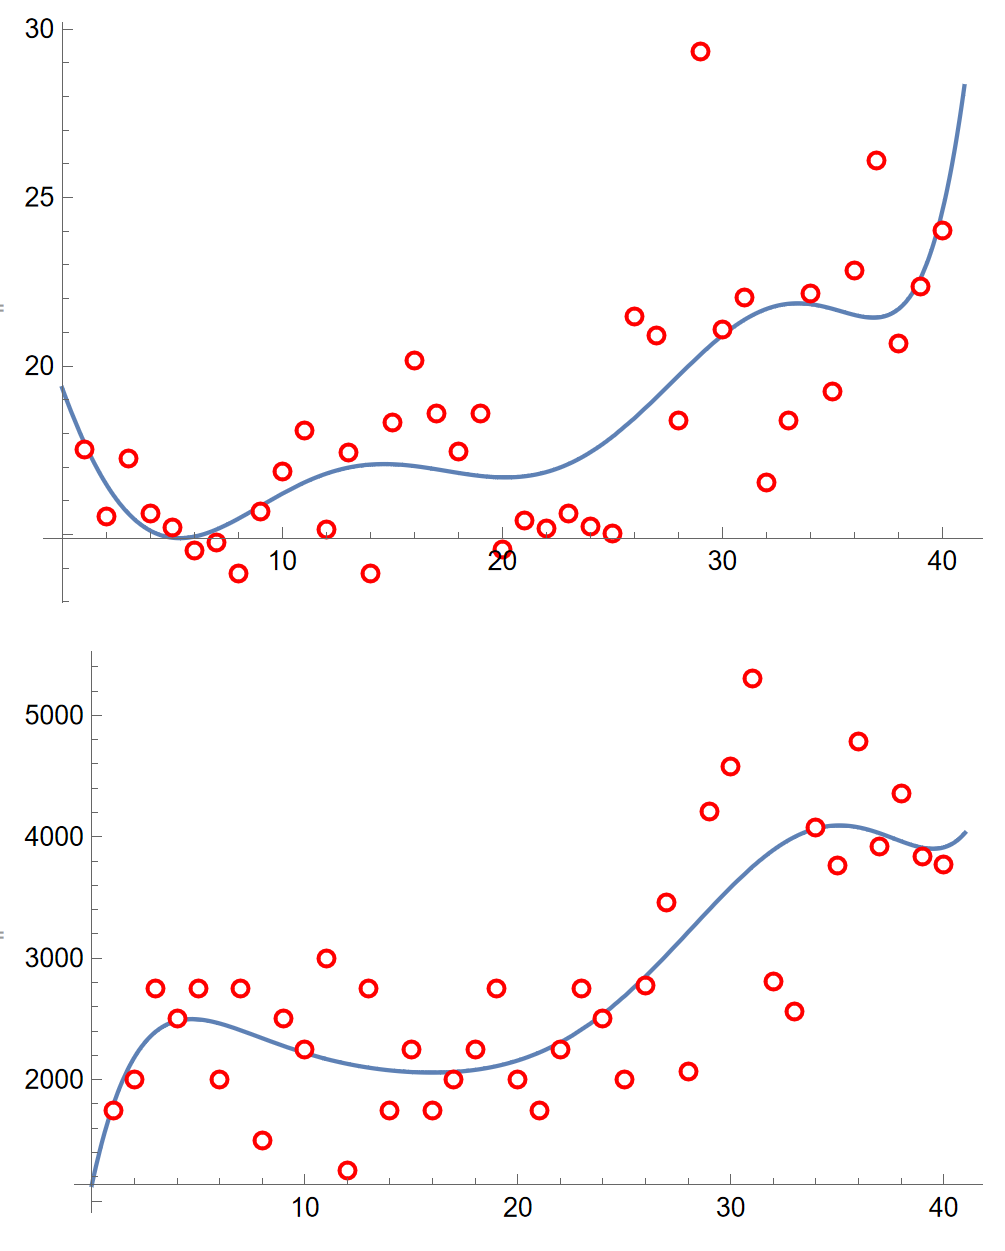
get this enter image description here

as you can see ,I had to go through the following steps

  • get point data
  • Constructing polynomial function
  • Point plotted on a graph
  • Do the fitting and draw the fitting curve
  • Plot the fitting curve and data points on a graph

As you can see, I have two sets of data here, so I copy and paste a lot, in fact, I have many sets of data, so copying and pasting over and over again is obviously not a good idea.

Is there any way to package all of this into a function?

For example, if I input the data of the points and the number of fits I can draw the fit curve and the point graph directly

$\endgroup$
7
  • $\begingroup$ Since you can read Chinese, check this: note.youdao.com/ynoteshare/… $\endgroup$
    – xzczd
    Commented Jul 2, 2022 at 13:34
  • $\begingroup$ @xzczd I will read it $\endgroup$ Commented Jul 2, 2022 at 14:16
  • $\begingroup$ You should read it right now. Also, relevant content can be easily found in the document: reference.wolfram.com/language/tutorial/… $\endgroup$
    – xzczd
    Commented Jul 2, 2022 at 14:34
  • $\begingroup$ @xzczd The actual problem is so much more complicated than the help document that it feels useless $\endgroup$ Commented Jul 2, 2022 at 15:11
  • 1
    $\begingroup$ Then you don't really understand it. As stated in the document, and the first Chinese tutorial you haven't clicked so far, all you need is just () and ;. $\endgroup$
    – xzczd
    Commented Jul 2, 2022 at 15:13

2 Answers 2

6
$\begingroup$

Use Module

$Version

(* "13.1.0 for Mac OS X x86 (64-bit) (June 16, 2022)" *)

Clear["Global`*"]

fit[data_?VectorQ, n : _Integer?NonNegative : 7, opts___] :=
 Module[
  {func = Fit[data, x^Range[0, n], x]},
  Show[
   Plot[Tooltip[func],
    {x, 0, Length@data + 1}],
   ListPlot[data,
    PlotStyle -> Red, 
    PlotMarkers -> "OpenMarkers"],
   FilterRules[{opts}, Options[Plot]], 
   Frame -> True,
   Axes -> False,
   PlotRange -> All]]

Examples,

bmiData = {17.53231562, 15.53238528, 17.26137457, 15.6088015, 15.20589021, 
   14.51292182, 14.75645275, 13.83305466, 15.69560048, 16.86902697, 
   18.0721242, 15.14403292, 17.44614778, 13.850415510, 18.32280354, 
   20.1631851, 18.59012493, 17.45527841, 18.58163511, 14.55731214, 
   15.40417624, 15.18792708, 15.62461325, 15.22882797, 15.02163115, 
   21.45492911, 20.89541272, 18.38647653, 29.34474265, 21.08535689, 
   22.02071132, 16.52876307, 18.38228254, 22.14403633, 19.2399927, 
   22.82261329, 26.10290031, 20.6759324, 22.34966855, 24.02533886};

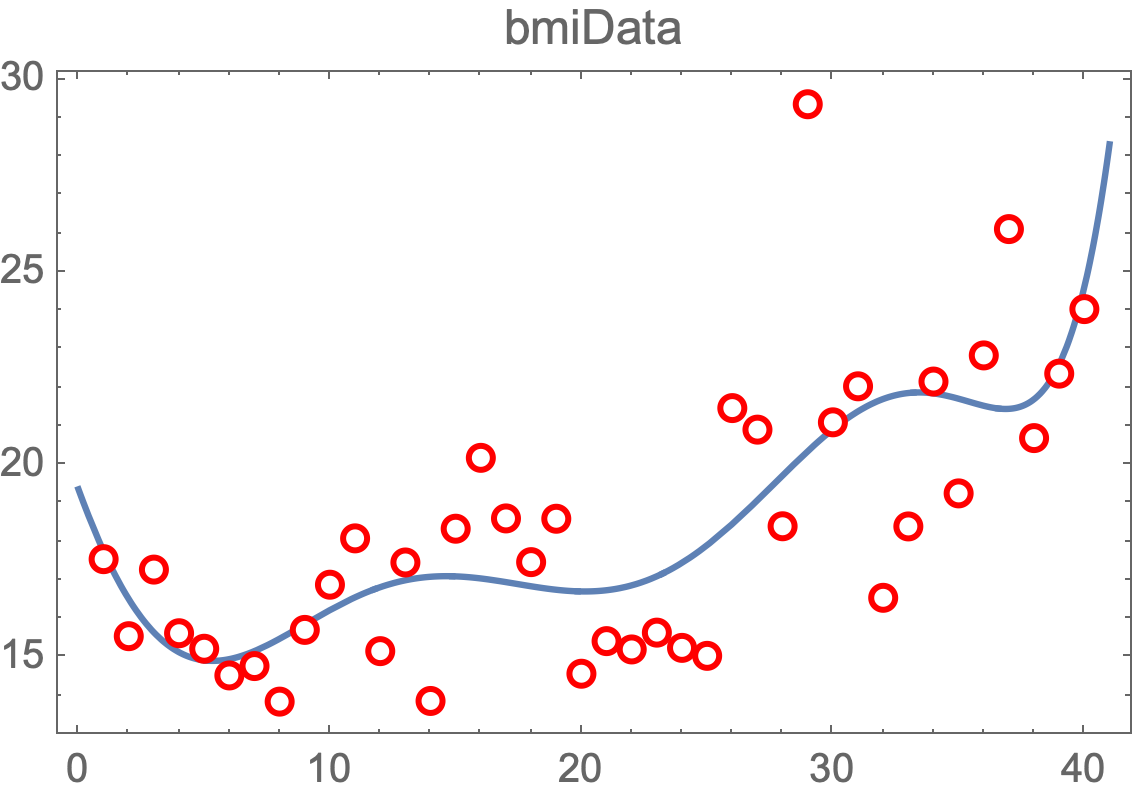
fit[bmiData, PlotLabel -> "bmiData"]

enter image description here

fhlData = {1750, 2000, 2750, 2500, 2750, 2000, 2750, 1500, 2500, 2250, 3000, 
   1250, 2750, 1750, 2250, 1750, 2000, 2250, 2750, 2000, 1750, 2250, 2750, 
   2500, 2000, 2772, 3458, 2065, 4208, 4579, 5300, 2811, 2563, 4075, 3762, 
   4781, 3919, 4357, 3839, 3770};

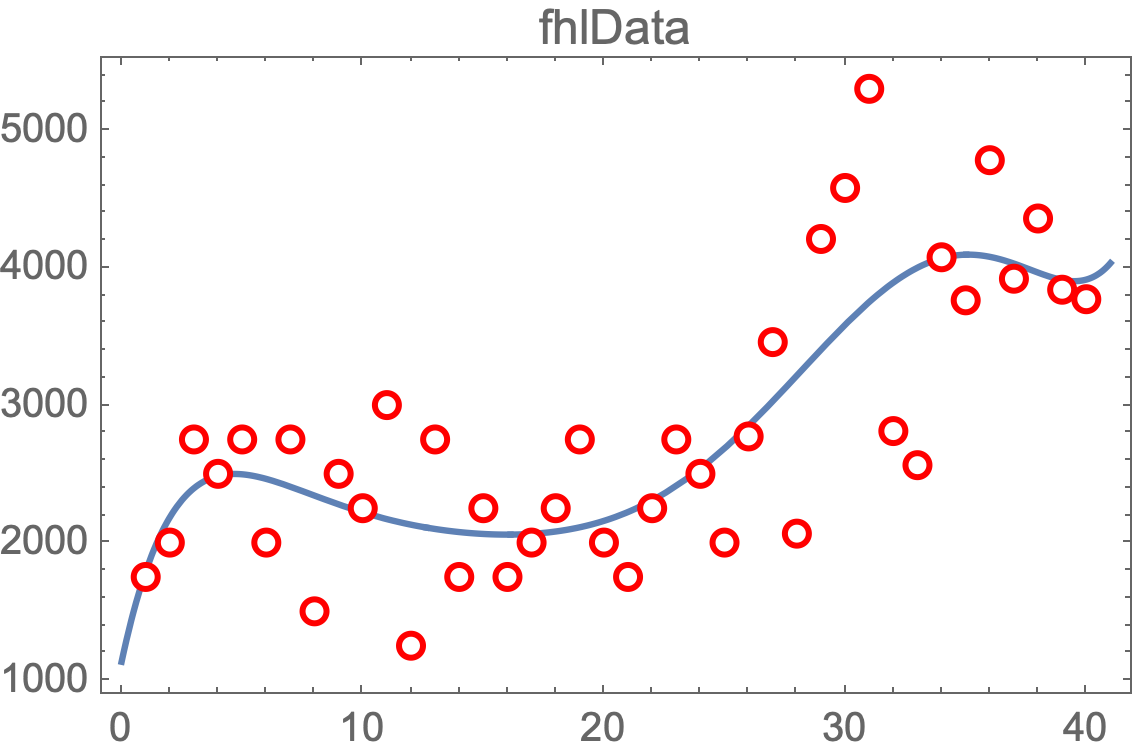
fit[fhlData, PlotLabel -> "fhlData"]

enter image description here

$\endgroup$
1
  • $\begingroup$ pretty good,I'm going to learn this code $\endgroup$ Commented Jul 2, 2022 at 15:13
5
$\begingroup$

OK, since OP fails to understand the document and tutorial linked in the comment, I'll write an answer just to prove my statement:

200 lines of code are not more complicated than 2 lines of code for defining a function. All you need is just () and ;. Oh, you already have ;s, so you just need a pair of ().

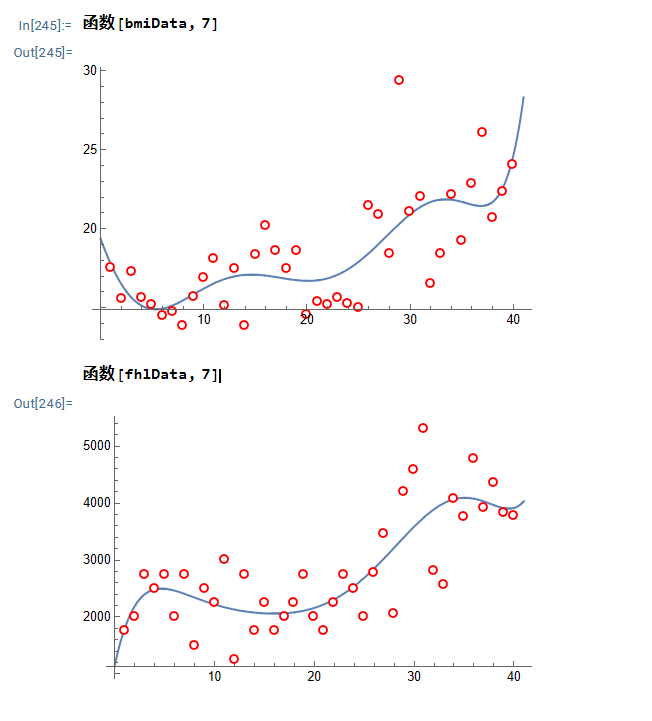
函数[bmiData_, n_] := (
  (*===数据点点图===*)
  bmiListPlt = ListPlot[bmiData, PlotStyle -> {Red}, PlotMarkers -> "OpenMarkers"];
  
  
  (*===数据点拟合===*)
  bmifit = Fit[bmiData, basisfun@n, x];
  
  (*===拟合图像===*)
  bmiFitPlt = Plot[bmifit, {x, 0, Length@bmiData + 1}, PlotRange -> All];
  
  
  (*===多项式拟合拟合和点图===*)
  bmishow = Show[bmiFitPlt, bmiListPlt]
  )

Definition of basisfun is the same as yours so omitted in this answer. Variable names are not modified, and are not localized with Module, etc., these aren't good habits of course. I don't modify them because they're not necessary. As mentioned above, all you need for defining a working function is just a pair of (). And it's my personal belief that a beginner should never try to pretend to be professional with Module, etc. if he doesn't really understand its usage.

Then the function can be used like

函数[bmiData, 7]

函数[fhlData, 7]

enter image description here

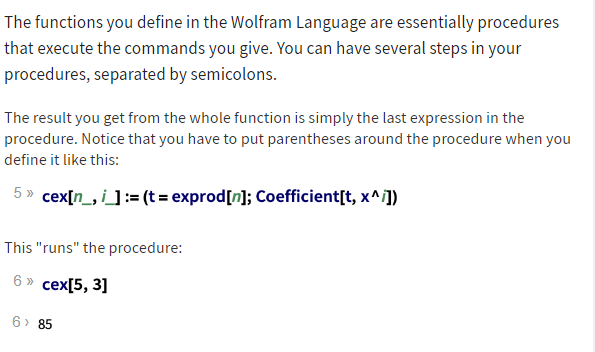
Now do you still feel it more complicated than the example in document?:

enter image description here

$\endgroup$
1
  • $\begingroup$ Magic function name. :) $\endgroup$
    – yode
    Commented Jul 2, 2022 at 16:26

Not the answer you're looking for? Browse other questions tagged or ask your own question.