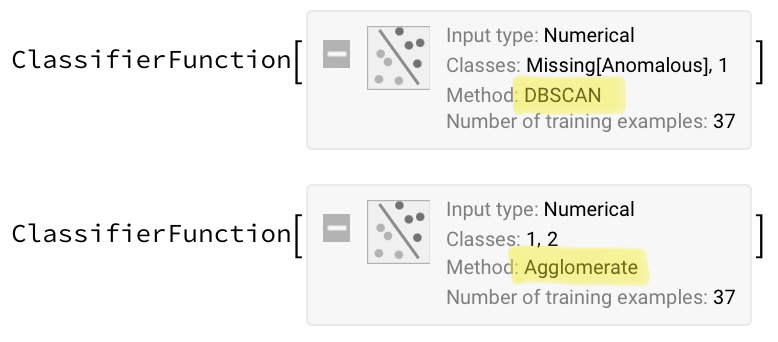
I have a question about FindClusters function. It seems that it behaves rather strangely when I pass a specific dataset to it. I am trying to use it in a bigger set of code, but I will illustrate my issue with an example.
Suppose we have the following list:
{0.79828, 0.0066479, 0.588481, 0.61007, 0., 0.00166839, 0.00498368, 0.674149, 0.662627, 0.0003537,
0.00822986, 0.00438603, 0.595791, 0.00667167, 0.297568, 0.000147291, 0.290336,
0.0128546, 0.793574, 0.00505361, 0.00254154, 0.00502201, 0.0170808, 0.018445, 0.0127057,
0.00720843, 0.00539111, 0.0201769, 0.0102616, 0.00579664, 0.00455612,0.00840309, 0.00307958,
0.0054002, 0.00730627, 0.000430262, 0.0211624}
When I use FindClusters by itself, i.e. without an argument for the number of clusters, the output is 2 clusters:
FindClusters[{0.79828, 0.0066479, 0.588481, 0.61007, 0.,
  0.00166839, 0.00498368, 0.674149, 0.662627, 0.0003537, 0.00822986,
  0.00438603, 0.595791, 0.00667167, 0.297568, 0.000147291, 0.290336,
  0.0128546, 0.793574, 0.00505361, 0.00254154, 0.00502201, 0.0170808,
  0.018445, 0.0127057, 0.00720843, 0.00539111, 0.0201769, 0.0102616,
  0.00579664, 0.00455612, 0.00840309, 0.00307958, 0.0054002,
  0.00730627, 0.000430262, 0.0211624}]

{{0.79828, 0.588481, 0.61007, 0.674149, 0.662627, 0.595791,
  0.297568, 0.290336, 0.793574}, {0.0066479, 0., 0.00166839,
  0.00498368, 0.0003537, 0.00822986, 0.00438603, 0.00667167,
  0.000147291, 0.0128546, 0.00505361, 0.00254154, 0.00502201,
  0.0170808, 0.018445, 0.0127057, 0.00720843, 0.00539111, 0.0201769,
  0.0102616, 0.00579664, 0.00455612, 0.00840309, 0.00307958,
  0.0054002, 0.00730627, 0.000430262, 0.0211624}}
This is the result I expect since the values I would like to separate are the ones close to 0. We can see that the values close to 0.8, 0.6, 0.7 and 0.3 are in the same cluster, while the values close to 0 are in a different one.
So far, I understand, however, when I force FindClusters to look specifically for 2 clusters I get the following:
FindClusters[{0.79828, 0.0066479, 0.588481, 0.61007, 0.,
  0.00166839, 0.00498368, 0.674149, 0.662627, 0.0003537, 0.00822986,
  0.00438603, 0.595791, 0.00667167, 0.297568, 0.000147291, 0.290336,
  0.0128546, 0.793574, 0.00505361, 0.00254154, 0.00502201, 0.0170808,
  0.018445, 0.0127057, 0.00720843, 0.00539111, 0.0201769, 0.0102616,
  0.00579664, 0.00455612, 0.00840309, 0.00307958, 0.0054002,
  0.00730627, 0.000430262, 0.0211624}, 2]

{{0.79828, 0.588481, 0.61007, 0.674149, 0.662627, 0.595791,
  0.793574}, {0.0066479, 0., 0.00166839, 0.00498368, 0.0003537,
  0.00822986, 0.00438603, 0.00667167, 0.297568, 0.000147291, 0.290336,
   0.0128546, 0.00505361, 0.00254154, 0.00502201, 0.0170808, 0.018445,
   0.0127057, 0.00720843, 0.00539111, 0.0201769, 0.0102616,
  0.00579664, 0.00455612, 0.00840309, 0.00307958, 0.0054002,
  0.00730627, 0.000430262, 0.0211624}}
As you can see the values close to 0.8, 0.6, 0.7 are in the same cluster again, but this time, the values close to 0.3 are actually in the other cluster - with the values close to 0. Does anyone have any idea why that happens? I tried playing around with the DistanceFunction argument but that didn't really help.
I want to able to separate my data (this is just a sample and it is likely that real data will be with a lot more variance) in 2 clusters, where one cluster is the values close to 0 and the other is everything else. I would prefer not using a threshold and have a more data driven approach. My main concern here is that FindClusters appears to be less reproducible than I hoped. Perhaps I don't understand how the function actually works.
Thank you for any comments.

