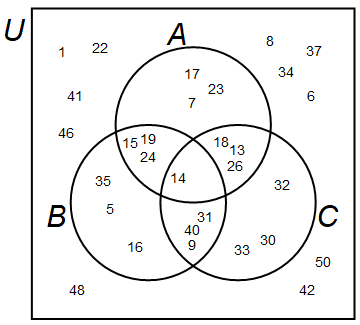
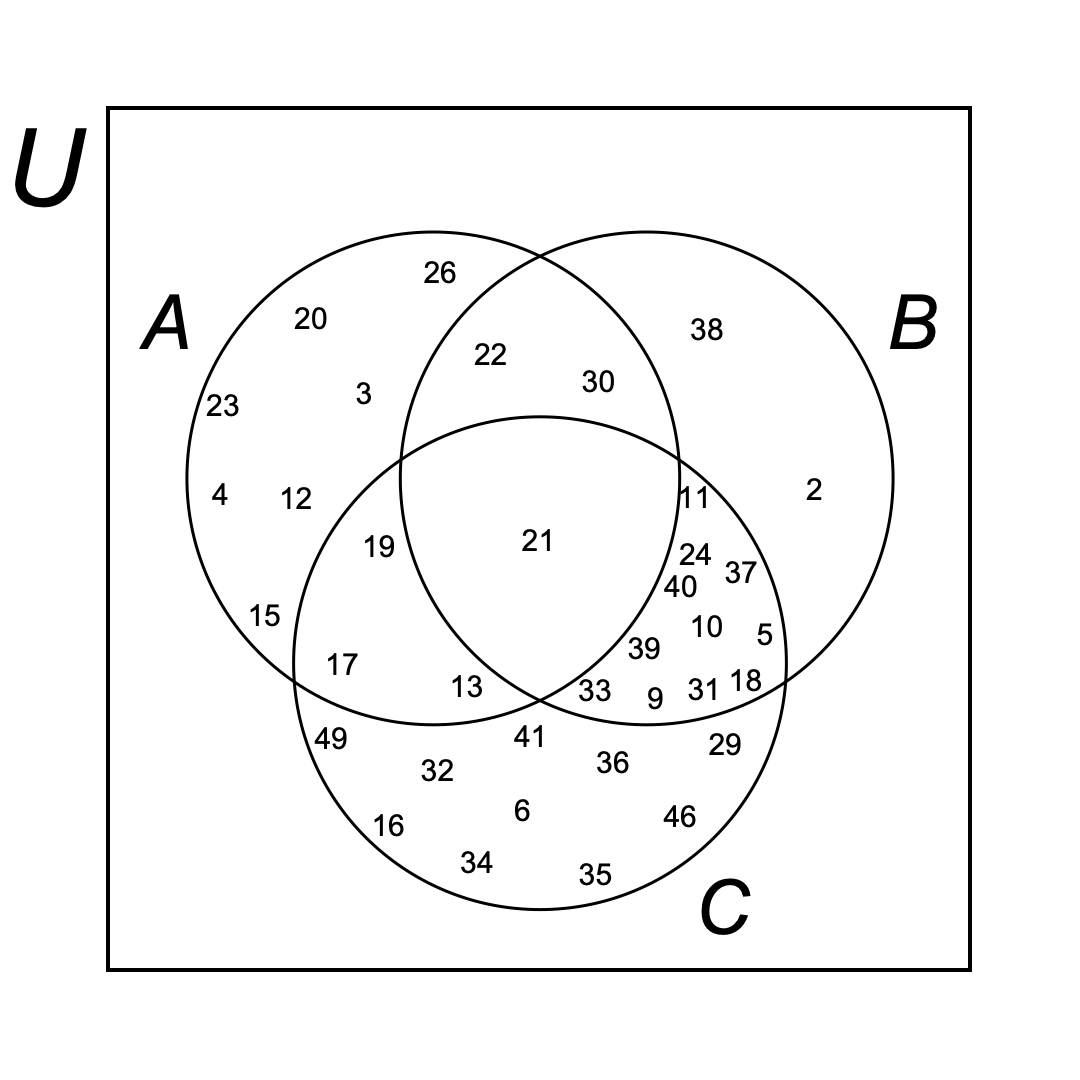
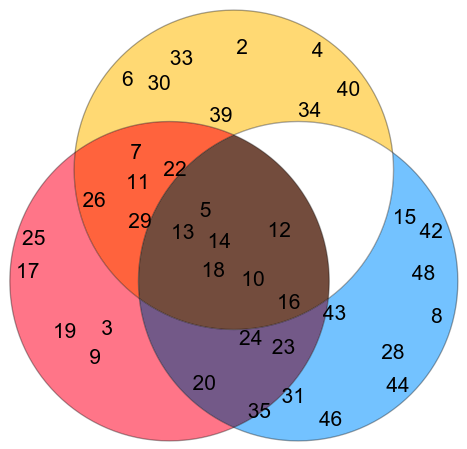
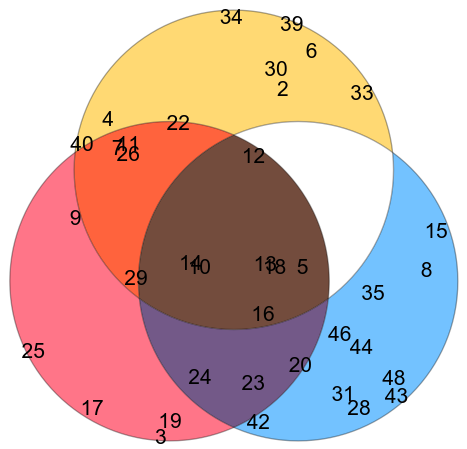
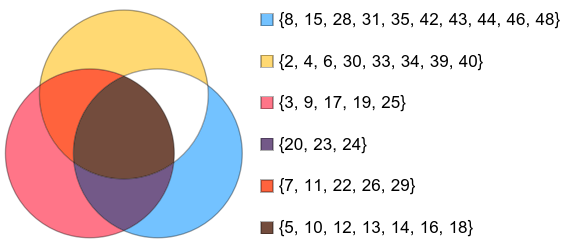
There is an answer about how to create Venn diagrams here: Create a Venn Diagram. I'm using VennDiagram[] function from Method 2.
Let's firstly create the sets.
u = Range[1, 50]
a = RandomSample[Range[3, 30], 20]
b = RandomSample[Range[2, 40], 20]
c = RandomSample[Range[4, 49], 20]
Slightly unsure what you meant by having u random as well. Are you thinking of firstly randomly choosing u, and then choosing random subsets of u, which would be between 3 and 30? Also, how many numbers would you like to choose? Here, I assumed that you want u to be all the numbers from 1 to 50, then choose a, b, c within the intervals you mentioned (without repetition) with 20 random elements (just an example).
Then, let's create the Venn diagram (this may take some time):
venn = VennDiagram[{a, b, c}, SetLabels -> {"A", "B", "C"},
  LabelStyle -> 14, ElementStyle -> 12]
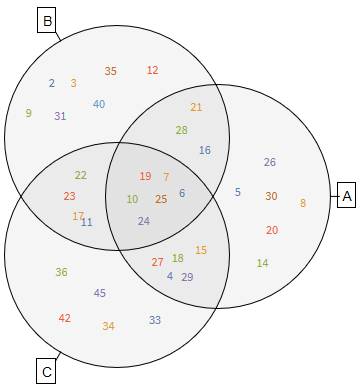
Presumably, you don't want the labels to be coloured, plus you wanted to have the universe u and the rest of the numbers within it. So, let's do that by wrapping the Venn diagram within a rectangle representing u and adding the labels.
Show[
 Graphics[{EdgeForm[Black], White, Rectangle[{-2, -2}, {2, 2}]}],
 Graphics[venn /. (FontColor -> _) -> (FontColor -> Black)],
 Graphics[Text[Framed[Style["U", 14]], {-2.2, 1.8}]],

 compl = Reverse@Complement[u, a, b, c];
 Map[
  Graphics[Text[Style[#[[2]], 12], #[[1]]]] &,
  Table[{{-1.7 +
      RandomReal[{-0.1, 0.1}], (i/Length@compl - 0.5 - 0.5/
        Length@compl) 3.6}, compl[[i]]}, {i, Length@compl}]
  ]
 ]
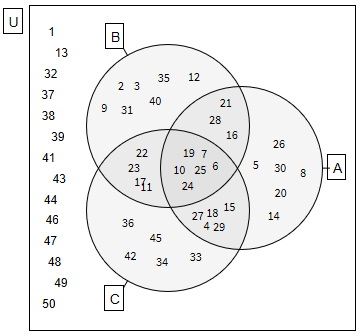
Hope that's what you wanted. Note that sometimes the labels overlap in the last diagram, I would suggest re-running the code and hoping for no overlaps.
If you wanted to somehow differently choose u, a, b, and c, then just change the way you create them. For example:
u = RandomSample[Range[1, 50], 30]
a = RandomSample[Intersection[Range[3, 30], u], 10]
b = RandomSample[Intersection[Range[2, 40], u], 10]
c = RandomSample[Intersection[Range[4, 49], u], 10]
creates u, which is 30 random integers between 1 and 50, then a, b, and c are 10 random integers in the ranges you mentioned chosen from u. Example below.
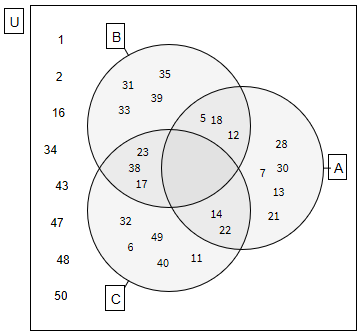
Edit: Full code as per request.
Options[VennDiagram] =
  Join[{SetLabels -> None, ElementStyle -> {}}, Options[Graphics]];

VennDiagram[lists : {_List ..}, opts : OptionsPattern[]] :=
 Module[{d = .6, r = 1, thickness = .05, n = Length@lists, cases,
   labels, elements, disks, region, outlines, points, bounds, cloud,
   setlabels, anchor},
  disks = NestList[
    TransformedRegion[#, RotationTransform[2 Pi/n, {0, 0}]] &,
    Disk[{d, 0}, r], n - 1];
  setlabels =
   If[(labelstrings = OptionValue[SetLabels]) === None, {},
    Table[anchor = {Cos[2 Pi (i - 1)/n], Sin[2 Pi (i - 1)/n]};
     {Line[(d + r) {anchor, 1.05 anchor}],
      Text[Framed@labelstrings[[i]], 1.04 (d + r) anchor,
       Sign /@ -anchor]}, {i, n}]];
  outlines =
   RegionUnion @@
    RegionDifference @@@ (disks /.
       Disk[p_, r_] -> {Disk[p, (1 + thickness) r],
         Disk[p, (1 - thickness) r]});
  cases = Most@Tuples[{True, False}, n];
  labels =
   Flatten@Table[
     If[(elements =
         Complement[Intersection @@ Pick[lists, case],
          Union @@ Pick[lists, Not /@ case]]) == {}, {},
      region =
       RegionDifference[RegionIntersection[Pick[disks, case]],
        RegionUnion @@ Flatten@{Pick[disks, Not /@ case], outlines}];
      If[Length[elements] == 1,
       elements = Join[elements, {Invisible["a"], Invisible["b"]}]];
      cloud = WordCloud[elements, region, MaxItems -> All];
      cloud = DeleteCases[cloud, FontSize -> _, Infinity] /.
        Style[args__] -> Style[args, OptionValue@ElementStyle];
      points = MeshCoordinates@DiscretizeRegion@region;
      bounds = MinMax /@ Transpose@points;
      Inset[cloud, Mean /@ bounds,
       Center, -Subtract @@@ bounds]], {case, cases}];
  Show[Graphics[{FaceForm[GrayLevel[0, .04]], EdgeForm[Black],
     Style[setlabels, OptionValue@LabelStyle], disks, labels},
    FilterRules[{opts}, Options@Graphics]]]]

u = Range[1, 50]
a = RandomSample[Range[3, 30], 20]
b = RandomSample[Range[2, 40], 20]
c = RandomSample[Range[4, 49], 20]

venn = VennDiagram[{a, b, c}, SetLabels -> {"A", "B", "C"},
  LabelStyle -> 14, ElementStyle -> 12]

Show[Graphics[{EdgeForm[Black], White, Rectangle[{-2, -2}, {2, 2}]}],
 Graphics[venn /. (FontColor -> _) -> (FontColor -> Black)],
 Graphics[Text[Framed[Style["U", 14]], {-2.2, 1.8}]],
 compl = Reverse@Complement[u, a, b, c];
 Map[Graphics[Text[Style[#[[2]], 12], #[[1]]]] &,
  Table[{{-1.7 +
      RandomReal[{-0.1, 0.1}], (i/Length@compl - 0.5 -
        0.5/Length@compl) 3.6}, compl[[i]]}, {i, Length@compl}]]]
The second method, in case the one above doesn't work on your version of Mathematica:
RA = Disk[{0, 0.5}, 1];
RB = Disk[{-Sqrt[3]/3, -0.5}, 1];
RC = Disk[{Sqrt[3]/3, -0.5}, 1];
RU = Rectangle[{-Sqrt[3]/3 - 1.5, -2}, {Sqrt[3]/3 + 1.5, 2}];

getCoords[reg_, n_] := Module[{cellmeas, test, points, regd},
   cellmeas = 0.3;
   test = True;
   smallerreg =
    While[test,
     cellmeas /= 1.2;
     points =
      MeshPrimitives[
       DiscretizeRegion[reg, MaxCellMeasure -> cellmeas,
        PerformanceGoal -> "Speed"], {0, "Interior"}];
     test = Length@points < n + 1
     ];
   RandomSample[points, n][[;; , 1]]
   ];

OA = BooleanRegion[#1 && \[Not] #2 && \[Not] #3 && #4 &, {RA, RB, RC,
    RU}];
OB = BooleanRegion[\[Not] #1 && #2 && \[Not] #3 && #4 &, {RA, RB, RC,
    RU}];
OC = BooleanRegion[\[Not] #1 && \[Not] #2 && #3 && #4 &, {RA, RB, RC,
    RU}];
OAB = BooleanRegion[#1 && #2 && \[Not] #3 && #4 &, {RA, RB, RC, RU}];
OAC = BooleanRegion[#1 && \[Not] #2 && #3 && #4 &, {RA, RB, RC, RU}];
OBC = BooleanRegion[\[Not] #1 && #2 && #3 && #4 &, {RA, RB, RC, RU}];
OABC = BooleanRegion[#1 && #2 && #3 && #4 &, {RA, RB, RC, RU}];
OU = BooleanRegion[\[Not] #1 && \[Not] #2 && \[Not] #3 && #4 &, {RA,
    RB, RC, RU}];

u = RandomSample[Range[1, 50], 30]
a = RandomSample[Intersection[Range[3, 30], u], 10]
b = RandomSample[Intersection[Range[2, 40], u], 10]
c = RandomSample[Intersection[Range[4, 49], u], 10]

PA = Complement[a, b, c];
PB = Complement[b, a, c];
PC = Complement[c, a, b];
PAB = Complement[Intersection[a, b], c];
PAC = Complement[Intersection[a, c], b];
PBC = Complement[Intersection[b, c], a];
PABC = Intersection[a, b, c];
PU = Complement[u, a, b, c];

Show[
 Graphics[{Thick, RegionBoundary /@ {RA, RB, RC, RU}}],
 MapThread[Graphics@Text[#1, #2] &, {PA, getCoords[OA, Length@PA]}],
 MapThread[Graphics@Text[#1, #2] &, {PB, getCoords[OB, Length@PB]}],
 MapThread[Graphics@Text[#1, #2] &, {PC, getCoords[OC, Length@PC]}],
 MapThread[Graphics@Text[#1, #2] &, {PAB, getCoords[OAB, Length@PAB]}],
 MapThread[Graphics@Text[#1, #2] &, {PAC, getCoords[OAC, Length@PAC]}],
 MapThread[Graphics@Text[#1, #2] &, {PBC, getCoords[OBC, Length@PBC]}],
 MapThread[
  Graphics@Text[#1, #2] &, {PABC, getCoords[OABC, Length@PABC]}],
 MapThread[Graphics@Text[#1, #2] &, {PU, getCoords[OU, Length@PU]}],
 Graphics[{Style[Text["U", {-2.3, 1.7}], Italic, 30]}],
 Graphics[{Style[Text["A", {-0.2, 1.65}], Italic, 30]}],
 Graphics[{Style[Text["B", {-1.75, -0.7}], Italic, 30]}],
 Graphics[{Style[Text["C", {1.75, -0.7}], Italic, 30]}]
 ]
