4
$\begingroup$

Given a universe u with random numbers between 1 and 50 and three sets a,b,c, that have random numbers a between 3 and 30, b between 2 and 40 and c between 4 and 49

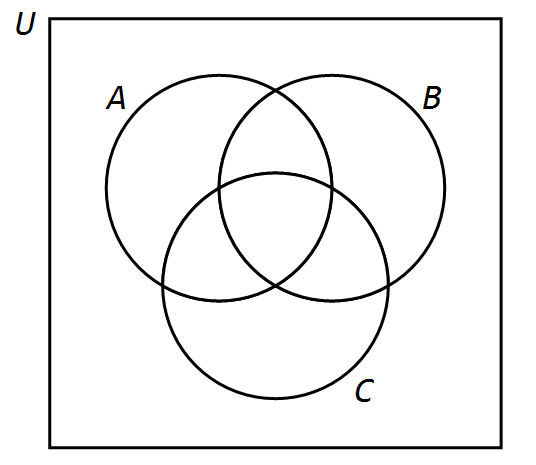
How can I represent the sets a, b and c and the universe u in a diagram of the type

enter image description here

I have tried with Random Sample , Random Choice and I have looked in the forum , but the programming is beyond me , This is to generate different exercises for my students , very grateful in advance.

Edit:This is an example, the limits of elements can be varied, which is not how to make them be distributed completely randomly .

$\endgroup$

4 Answers 4

7
$\begingroup$

There is an answer about how to create Venn diagrams here: Create a Venn Diagram. I'm using VennDiagram[] function from Method 2.

Let's firstly create the sets.

u = Range[1, 50]
a = RandomSample[Range[3, 30], 20]
b = RandomSample[Range[2, 40], 20]
c = RandomSample[Range[4, 49], 20]

Slightly unsure what you meant by having u random as well. Are you thinking of firstly randomly choosing u, and then choosing random subsets of u, which would be between 3 and 30? Also, how many numbers would you like to choose? Here, I assumed that you want u to be all the numbers from 1 to 50, then choose a, b, c within the intervals you mentioned (without repetition) with 20 random elements (just an example).

Then, let's create the Venn diagram (this may take some time):

venn = VennDiagram[{a, b, c}, SetLabels -> {"A", "B", "C"}, 
  LabelStyle -> 14, ElementStyle -> 12]
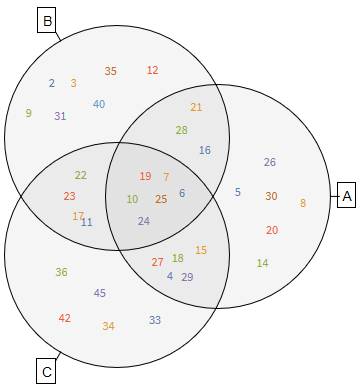
Venn Diagram

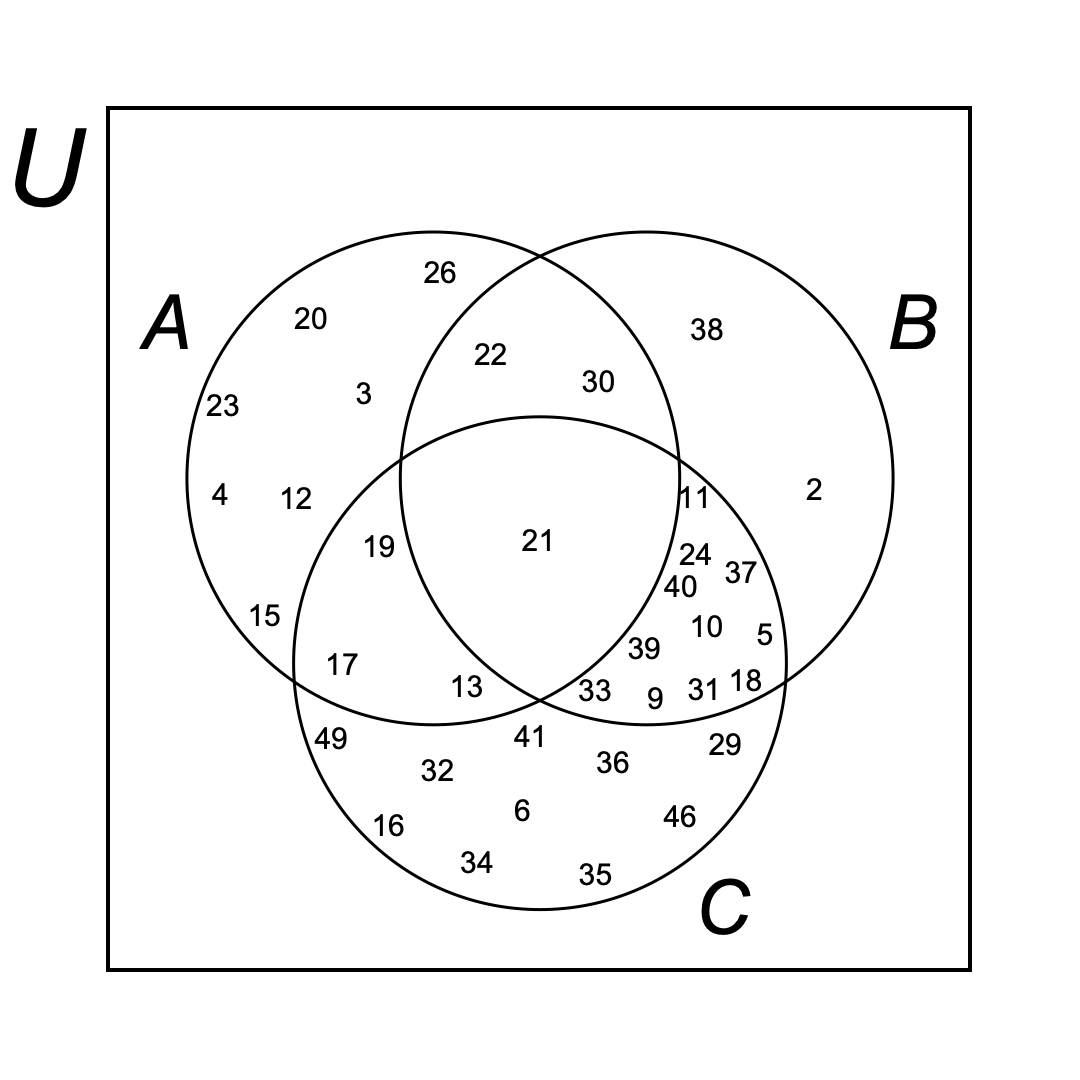
Presumably, you don't want the labels to be coloured, plus you wanted to have the universe u and the rest of the numbers within it. So, let's do that by wrapping the Venn diagram within a rectangle representing u and adding the labels.

Show[
 Graphics[{EdgeForm[Black], White, Rectangle[{-2, -2}, {2, 2}]}],
 Graphics[venn /. (FontColor -> _) -> (FontColor -> Black)],
 Graphics[Text[Framed[Style["U", 14]], {-2.2, 1.8}]],
 
 compl = Reverse@Complement[u, a, b, c];
 Map[
  Graphics[Text[Style[#[[2]], 12], #[[1]]]] &,
  Table[{{-1.7 + 
      RandomReal[{-0.1, 0.1}], (i/Length@compl - 0.5 - 0.5/
        Length@compl) 3.6}, compl[[i]]}, {i, Length@compl}]
  ]
 ]
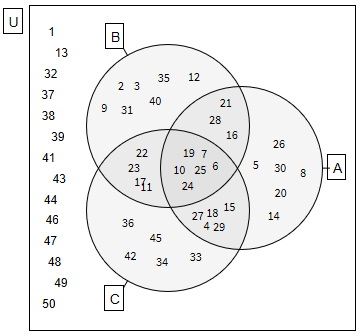
Venn diagram with universe

Hope that's what you wanted. Note that sometimes the labels overlap in the last diagram, I would suggest re-running the code and hoping for no overlaps.

If you wanted to somehow differently choose u, a, b, and c, then just change the way you create them. For example:

u = RandomSample[Range[1, 50], 30]
a = RandomSample[Intersection[Range[3, 30], u], 10]
b = RandomSample[Intersection[Range[2, 40], u], 10]
c = RandomSample[Intersection[Range[4, 49], u], 10]

creates u, which is 30 random integers between 1 and 50, then a, b, and c are 10 random integers in the ranges you mentioned chosen from u. Example below.
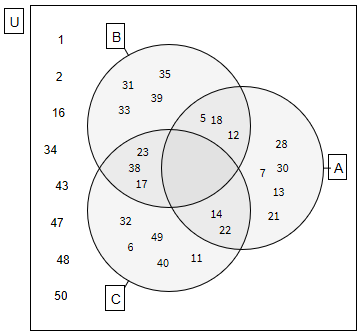
Another Venn diagram

Edit: Full code as per request.

Options[VennDiagram] = 
  Join[{SetLabels -> None, ElementStyle -> {}}, Options[Graphics]];

VennDiagram[lists : {_List ..}, opts : OptionsPattern[]] := 
 Module[{d = .6, r = 1, thickness = .05, n = Length@lists, cases, 
   labels, elements, disks, region, outlines, points, bounds, cloud, 
   setlabels, anchor}, 
  disks = NestList[
    TransformedRegion[#, RotationTransform[2 Pi/n, {0, 0}]] &, 
    Disk[{d, 0}, r], n - 1];
  setlabels = 
   If[(labelstrings = OptionValue[SetLabels]) === None, {}, 
    Table[anchor = {Cos[2 Pi (i - 1)/n], Sin[2 Pi (i - 1)/n]};
     {Line[(d + r) {anchor, 1.05 anchor}], 
      Text[Framed@labelstrings[[i]], 1.04 (d + r) anchor, 
       Sign /@ -anchor]}, {i, n}]];
  outlines = 
   RegionUnion @@ 
    RegionDifference @@@ (disks /. 
       Disk[p_, r_] -> {Disk[p, (1 + thickness) r], 
         Disk[p, (1 - thickness) r]});
  cases = Most@Tuples[{True, False}, n];
  labels = 
   Flatten@Table[
     If[(elements = 
         Complement[Intersection @@ Pick[lists, case], 
          Union @@ Pick[lists, Not /@ case]]) == {}, {}, 
      region = 
       RegionDifference[RegionIntersection[Pick[disks, case]], 
        RegionUnion @@ Flatten@{Pick[disks, Not /@ case], outlines}];
      If[Length[elements] == 1, 
       elements = Join[elements, {Invisible["a"], Invisible["b"]}]];
      cloud = WordCloud[elements, region, MaxItems -> All];
      cloud = DeleteCases[cloud, FontSize -> _, Infinity] /.
        Style[args__] -> Style[args, OptionValue@ElementStyle];
      points = MeshCoordinates@DiscretizeRegion@region;
      bounds = MinMax /@ Transpose@points;
      Inset[cloud, Mean /@ bounds, 
       Center, -Subtract @@@ bounds]], {case, cases}];
  Show[Graphics[{FaceForm[GrayLevel[0, .04]], EdgeForm[Black], 
     Style[setlabels, OptionValue@LabelStyle], disks, labels}, 
    FilterRules[{opts}, Options@Graphics]]]]

u = Range[1, 50]
a = RandomSample[Range[3, 30], 20]
b = RandomSample[Range[2, 40], 20]
c = RandomSample[Range[4, 49], 20]

venn = VennDiagram[{a, b, c}, SetLabels -> {"A", "B", "C"}, 
  LabelStyle -> 14, ElementStyle -> 12]

Show[Graphics[{EdgeForm[Black], White, Rectangle[{-2, -2}, {2, 2}]}], 
 Graphics[venn /. (FontColor -> _) -> (FontColor -> Black)], 
 Graphics[Text[Framed[Style["U", 14]], {-2.2, 1.8}]], 
 compl = Reverse@Complement[u, a, b, c];
 Map[Graphics[Text[Style[#[[2]], 12], #[[1]]]] &, 
  Table[{{-1.7 + 
      RandomReal[{-0.1, 0.1}], (i/Length@compl - 0.5 - 
        0.5/Length@compl) 3.6}, compl[[i]]}, {i, Length@compl}]]]

The second method, in case the one above doesn't work on your version of Mathematica:

RA = Disk[{0, 0.5}, 1];
RB = Disk[{-Sqrt[3]/3, -0.5}, 1];
RC = Disk[{Sqrt[3]/3, -0.5}, 1];
RU = Rectangle[{-Sqrt[3]/3 - 1.5, -2}, {Sqrt[3]/3 + 1.5, 2}];

getCoords[reg_, n_] := Module[{cellmeas, test, points, regd},
   cellmeas = 0.3;
   test = True;
   smallerreg =
    While[test,
     cellmeas /= 1.2;
     points = 
      MeshPrimitives[
       DiscretizeRegion[reg, MaxCellMeasure -> cellmeas, 
        PerformanceGoal -> "Speed"], {0, "Interior"}];
     test = Length@points < n + 1
     ];
   RandomSample[points, n][[;; , 1]]
   ];

OA = BooleanRegion[#1 && \[Not] #2 && \[Not] #3 && #4 &, {RA, RB, RC, 
    RU}];
OB = BooleanRegion[\[Not] #1 && #2 && \[Not] #3 && #4 &, {RA, RB, RC, 
    RU}];
OC = BooleanRegion[\[Not] #1 && \[Not] #2 && #3 && #4 &, {RA, RB, RC, 
    RU}];
OAB = BooleanRegion[#1 && #2 && \[Not] #3 && #4 &, {RA, RB, RC, RU}];
OAC = BooleanRegion[#1 && \[Not] #2 && #3 && #4 &, {RA, RB, RC, RU}];
OBC = BooleanRegion[\[Not] #1 && #2 && #3 && #4 &, {RA, RB, RC, RU}];
OABC = BooleanRegion[#1 && #2 && #3 && #4 &, {RA, RB, RC, RU}];
OU = BooleanRegion[\[Not] #1 && \[Not] #2 && \[Not] #3 && #4 &, {RA, 
    RB, RC, RU}];

u = RandomSample[Range[1, 50], 30]
a = RandomSample[Intersection[Range[3, 30], u], 10]
b = RandomSample[Intersection[Range[2, 40], u], 10]
c = RandomSample[Intersection[Range[4, 49], u], 10]

PA = Complement[a, b, c];
PB = Complement[b, a, c];
PC = Complement[c, a, b];
PAB = Complement[Intersection[a, b], c];
PAC = Complement[Intersection[a, c], b];
PBC = Complement[Intersection[b, c], a];
PABC = Intersection[a, b, c];
PU = Complement[u, a, b, c];

Show[
 Graphics[{Thick, RegionBoundary /@ {RA, RB, RC, RU}}],
 MapThread[Graphics@Text[#1, #2] &, {PA, getCoords[OA, Length@PA]}],
 MapThread[Graphics@Text[#1, #2] &, {PB, getCoords[OB, Length@PB]}],
 MapThread[Graphics@Text[#1, #2] &, {PC, getCoords[OC, Length@PC]}],
 MapThread[Graphics@Text[#1, #2] &, {PAB, getCoords[OAB, Length@PAB]}],
 MapThread[Graphics@Text[#1, #2] &, {PAC, getCoords[OAC, Length@PAC]}],
 MapThread[Graphics@Text[#1, #2] &, {PBC, getCoords[OBC, Length@PBC]}],
 MapThread[
  Graphics@Text[#1, #2] &, {PABC, getCoords[OABC, Length@PABC]}],
 MapThread[Graphics@Text[#1, #2] &, {PU, getCoords[OU, Length@PU]}],
 Graphics[{Style[Text["U", {-2.3, 1.7}], Italic, 30]}],
 Graphics[{Style[Text["A", {-0.2, 1.65}], Italic, 30]}],
 Graphics[{Style[Text["B", {-1.75, -0.7}], Italic, 30]}],
 Graphics[{Style[Text["C", {1.75, -0.7}], Italic, 30]}]
 ]
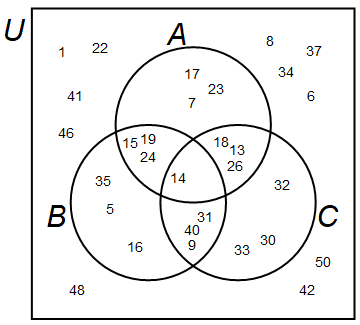
enter image description here

$\endgroup$
8
  • $\begingroup$ thanks for your interventions , but I have had problems executing them , what version of marhematica do you have , I have 12.1 , apparently there are new commands . $\endgroup$
    – BeTDa
    Commented Apr 4, 2022 at 12:30
  • $\begingroup$ Remember to add the VennDiagram function from the link at the top of my answer. Here is the full notebook (download button in the top right): wolframcloud.com/obj/marcin.szyniszewski/Published/… $\endgroup$
    – mszynisz
    Commented Apr 4, 2022 at 15:57
  • $\begingroup$ hi , For some strange reason I execute the code and I get only scribbles, would you be so kind as to put all your help in a single block with code, surely something is wrong, because I execute other different codes and they work well for me If they could upload everything to a .nb it would be fantastic very grateful in advance $\endgroup$
    – BeTDa
    Commented Apr 5, 2022 at 15:44
  • $\begingroup$ I sometimes get errors executing the VennDiagram function if I'm on 12.2, so maybe you have the same issue. I included the full code in my answer at the very end. Please use the second method if the first one doesn't work (this one doesn't use VennDiagram, so it may not be as pretty). $\endgroup$
    – mszynisz
    Commented Apr 5, 2022 at 21:48
  • $\begingroup$ The second method worked for me (it takes a while but it works), thanks the first throws me errors that I don't understand and stays in an endless execution $\endgroup$
    – BeTDa
    Commented Apr 6, 2022 at 1:37
5
$\begingroup$

the 'math' code

Remove[universe,a,b,c,onlya,onlyb,onlyc,onlyab,onlybc,onlyca,onlyabc]
universe = Range[1, 50];
a = RandomSample[#, RandomInteger@{1, Length@#}]\
  &[universe ⋂ Range[3, 30]];
b = RandomSample[#, RandomInteger@{1, Length@#}]\
  &[universe ⋂ Range[2, 40]];
c = RandomSample[#, RandomInteger@{1, Length@#}]\
  &[universe ⋂ Range[4, 49]];
onlya = a ⋂ Complement[universe, b ⋃ c];
onlyb = b ⋂ Complement[universe, c ⋃ a];
onlyc = c ⋂ Complement[universe, a ⋃ b];
onlyab = a ⋂ b ⋂ Complement[universe, c];
onlybc = b ⋂ c ⋂ Complement[universe, a];
onlyca = c ⋂ a ⋂ Complement[universe, b];
onlyabc = a ⋂ b ⋂ c;

(*see that their pairwise intersections are empty*)
Intersection@@@Subsets[{onlya,onlyb,onlyc,onlyab,onlybc,onlyca,onlyabc},{2}]

Each of a, b, and c is some random size subset of $u\cap\{3...30\}$ or another subset of $u$. I use implicit functions (i.e. # and &) to do this for predictability of output -- if you're ok with fixed size a,b,c then there are easier ways of writing this. All of the only* sets may be turned into $\LaTeX$ code with TeXForm to auto-generate documents.

the graphics code

I'm using code from kirma's answer to another question https://mathematica.stackexchange.com/a/141215/74641. I called the function placepoints, and it works as a drop-in replacement for RandomPoint. It certainly can be broken for weird regions and other arguments, but for this purpose it's fine.

Remove[circleregions, regiona, regionb, regionc, regionab, regionbc, \
regionca, regionabc, placepoints]
placepoints = 
Switch[#2, 0, {}, 1, {RegionCentroid@#}, _, 
With[{reg = #, points = #2, samples = 10 #2, iterations = 20}, 
 Nest[With[{randoms = Join[#, RandomPoint[reg, samples]]}, 
    RegionNearest[reg][Mean@randoms[[#]] & /@ 
      Values@PositionIndex@Nearest[#, randoms]]] &, 
  RandomPoint[reg, points], iterations]]] &;

circleregions = {Circle[{0, -2}, 4], Circle[{Sqrt[3], 1}, 4], 
Circle[{-Sqrt[3], 1}, 4]};
regiona = 
DiscretizeRegion@
RegionDifference[Disk @@ circleregions[[3]], 
RegionUnion @@ Disk @@@ circleregions[[{1, 2}]]];
regionb = 
DiscretizeRegion@
RegionDifference[Disk @@ circleregions[[2]], 
RegionUnion @@ Disk @@@ circleregions[[{3, 1}]]];
regionc = 
DiscretizeRegion@
RegionDifference[Disk @@ circleregions[[1]], 
RegionUnion @@ Disk @@@ circleregions[[{2, 3}]]];
regionab = 
DiscretizeRegion@
RegionDifference[
RegionIntersection @@ Disk @@@ circleregions[[{2, 3}]], 
Disk @@ circleregions[[1]]];
regionbc = 
DiscretizeRegion@
RegionDifference[
RegionIntersection @@ Disk @@@ circleregions[[{1, 2}]], 
Disk @@ circleregions[[3]]];
regionca = 
DiscretizeRegion@
RegionDifference[
RegionIntersection @@ Disk @@@ circleregions[[{3, 1}]], 
Disk @@ circleregions[[2]]];
regionabc = 
DiscretizeRegion@
RegionIntersection[
RegionIntersection @@ Disk @@@ circleregions[[{1, 2}]], 
Disk @@ circleregions[[3]]];
Graphics[{
FaceForm[], EdgeForm@Black, Rectangle[-#, #] &@{7, 7}, 
Text[Style["U", FontSize -> [email protected], Italic], {-7, 7}, {1.5, 1}],
circleregions,
MapThread[Text, {onlya, placepoints[regiona, Length@onlya]}],
MapThread[Text, {onlyb, placepoints[regionb, Length@onlyb]}],
MapThread[Text, {onlyc, placepoints[regionc, Length@onlyc]}],
MapThread[Text, {onlyab, placepoints[regionab, Length@onlyab]}],
MapThread[Text, {onlybc, placepoints[regionbc, Length@onlybc]}],
MapThread[Text, {onlyca, placepoints[regionca, Length@onlyca]}],
MapThread[Text, {onlyabc, placepoints[regionabc, Length@onlyabc]}],
Text[Style["B", FontSize -> [email protected], Italic], 3.5 {Sqrt[3], 1}],
Text[Style["A", FontSize -> [email protected], Italic], 
3.5 {-Sqrt[3], 1}],
Text[Style["C", FontSize -> [email protected], Italic], {3, -6}]}, 
Frame -> None, PlotRangePadding -> [email protected]]

This code has quickly turned quite nasty, since I've tried my best to avoid more complicated constructs and explicitly written (generated) most of it. Nevertheless, we get something like

well placed

Hopefully you can peruse the code to see

  • changing of heads with @@ and @@@ to go from Circles to Disks
  • region arithmetic with RegionUnion etc
  • MapThread to go through locations and values in tandem
  • various graphics options

Let me know what does and doesn't make sense about this code, and what sort of output you're looking for.

$\endgroup$
7
  • $\begingroup$ thanks for your interventions , but I have had problems executing them , what version of marhematica do you have , I have 12.1 , apparently there are new commands . $\endgroup$
    – BeTDa
    Commented Apr 4, 2022 at 12:30
  • $\begingroup$ I'm on 12.1.1. What are the errors? $\endgroup$
    – Adam
    Commented Apr 4, 2022 at 19:34
  • $\begingroup$ please give me more time $\endgroup$
    – BeTDa
    Commented Apr 5, 2022 at 15:44
  • $\begingroup$ thanks, the code works quite well but in all executions it loads a lot on the right side -the generators can be modified so that they give not so extreme values -I don't know if you can modify but some numbers appear on top (one on top of the other) or on top of the lines of the circles (this way you don't know where the particular number is) $\endgroup$
    – BeTDa
    Commented Apr 6, 2022 at 1:50
  • $\begingroup$ @BeTDa how is this? $\endgroup$
    – Adam
    Commented Apr 6, 2022 at 17:44
4
$\begingroup$

Edit 02

There was a small bug in dealing with empty sets (e.g. the one that arises with the chosen random seed below). This is now fixed. Additionally, figured I'd play around with the new-ish HardcorePointProcess functionality to get more evenly-spaced labels:

shrinkPolygon[polygon_,sf_:0.85] := TransformedRegion[polygon,ScalingTransform[{sf, sf}, RegionCentroid[polygon]]]

postProcessVennDiagram[vd_] := 
 Block[{labels, polygons, rpts, text, r0, hs},
  labels = vd[[2, All, 2, 1, 1, 1, 1]];
  r0 = 2/(Sqrt[n] Sqrt[\[Pi]]) /. n -> Length[Join @@ labels];
  hs = HardcorePointProcess[1000, r0, 2];
  polygons = Cases[vd[[1, 1]], {Null, Polygon[a__]} :> Polygon[a]];
  rpts = MapThread[Take[RandomPointConfiguration[hs, shrinkPolygon[DiscretizeRegion[#1]]]["Points"], #2] &, {polygons, Length /@ labels}];
  text = Graphics[MapThread[Text[Style[#1, 16], #2] &, {Join @@ labels, Join @@ rpts}]];
  Show[vd[[1]], text, ImageSize -> 350]]

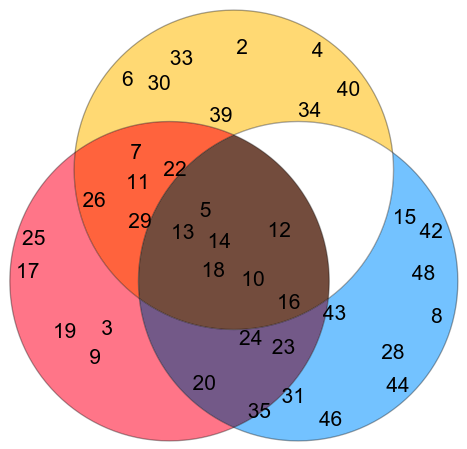
postProcessVennDiagram[vd]

enter image description here

Seems to work reasonably well. Note you might have to adjust the radius, r0, and scaling factor, sf, in the polygon shrinking (which I added to ensure the labels are completely maintained inside the regions).

Edit 01

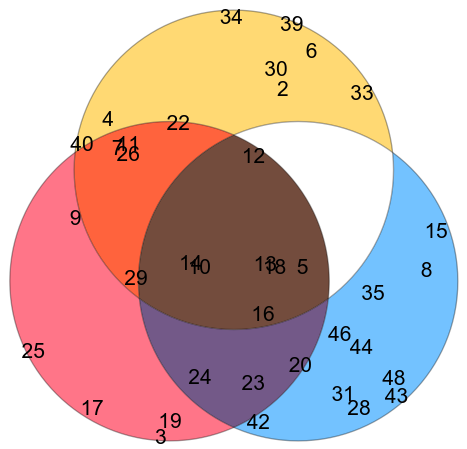
It should be possible to post-process the result to place the elements inside their corresponding region. For example, here I'm using RandomPoint but I suspect you can use some sort of Lloyd relaxation on a voronoi mesh to get them more evenly spaced:

postProcessVennDiagram[vd_] := 
 Block[{labels, length, polygons, rpts, text}, 
  labels = vd[[2, All, 2, 1, 1, 1, 1]];
  polygons = Cases[vd[[1, 1]], {Null, Polygon[a__]} :> Polygon[a]];
  rpts = MapThread[RandomPoint, {polygons, Length /@ labels}];
  text = Graphics[MapThread[Text[Style[#1, 16], #2] &, {Join @@ labels, Join @@ rpts}]];
  Show[vd[[1]], text, ImageSize -> 350]]

postProcessVennDiagram[vd]

enter image description here

Original Answer

There's a very nice Function Repository entry that makes this quite easy:

SeedRandom[25];
vd=With[{
  a = RandomSample[Range[3, 30], 20],
  b = RandomSample[Range[2, 40], 20],
  c = RandomSample[Range[4, 49], 20]
  },
 ResourceFunction["VennDiagram"][{a, b, c}]
 ]

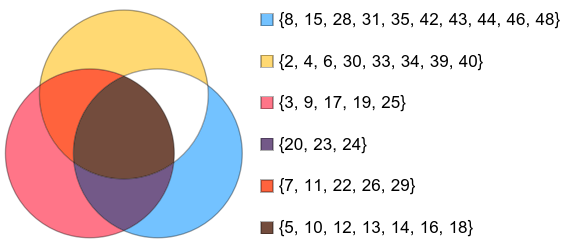
enter image description here

$\endgroup$
3
  • $\begingroup$ interesting, thanks. It is possible that the numbers appear inside the circles, it does not matter if they are bigger $\endgroup$
    – BeTDa
    Commented Apr 6, 2022 at 1:57
  • $\begingroup$ Apparently it doesn't turn out very well, because the numbers come out one on top of the other or in line with these, I don't know if you can improve it. It occurs to me that instead of that square with color, what it means should come out. That is, given a universe u instead of green output A ⋂ B -C = {18,27,33,34,37} etc I don't know if I can do that for every color $\endgroup$
    – BeTDa
    Commented Apr 7, 2022 at 23:21
  • $\begingroup$ See edit for dealing with overlapping labels. Not sure I understand the second part of your comment. Can you elaborate? $\endgroup$ Commented Apr 10, 2022 at 13:59
0
$\begingroup$
Graphics[{Black,Rectangle[{1.1, 1.1},{4.4, 4.4}],{Red, Circle[{3, 3}, 0.8]},
    {Red,Circle[{2.5, 2.5}, 0.8]},{Red,Circle[{2.3, 3.3}, 0.8]}}]
$\endgroup$
2
  • 1
    $\begingroup$ Not clear to me that this really answers the question. In any case, please add the result of your code. $\endgroup$
    – bbgodfrey
    Commented Apr 4, 2022 at 4:09
  • $\begingroup$ thanks for your interventions , but I have had problems executing them , what version of marhematica do you have , I have 12.1 , apparently there are new commands . $\endgroup$
    – BeTDa
    Commented Apr 4, 2022 at 12:30

Your Answer

By clicking “Post Your Answer”, you agree to our terms of service and acknowledge you have read our privacy policy.

Not the answer you're looking for? Browse other questions tagged or ask your own question.