This question is related to Export bug in combination with ParallelTable?.
The following code shows an even stranger bug than in the upper question.
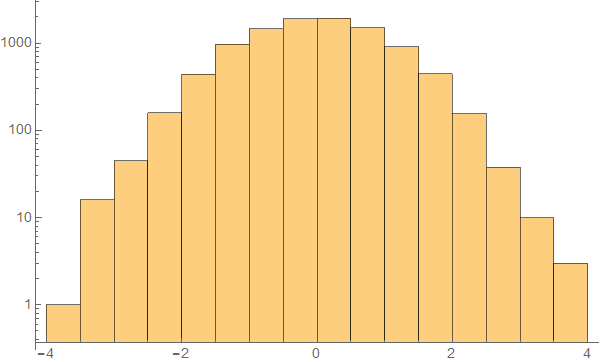
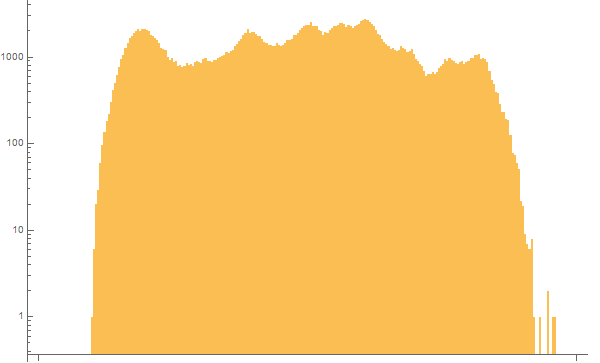
The y-axis should always be logarithmic, but in the resulting plot files it jumps randomly between logarithmic and linear. The linear axis numbers are wrong.
ChoiceDialog[{FileNameSetter[Dynamic[outputDir], "Directory"], Dynamic[outputDir]}];
SetDirectory[outputDir];

image = ColorConvert[ExampleData[{"TestImage", "Lena"}], "Grayscale"];
levels = ImageLevels[image, "Byte"];
hist = Histogram[WeightedData @@ Transpose[levels], 256,
   ScalingFunctions -> "Log", ImageSize -> 600];

ParallelTable[

  fileName = StringJoin[outputDir, "\\histogram_parallel_table_", ToString[i], ".png"];

  Export[fileName, hist, "PNG"],

  {i, 1, 10}

  ];
This error does not occur when Table is used or when logarithmic scaling is removed.
For one run I got e.g. the following two different plots (there are more):
i=1:
i=6:
I am programming with Mathematica 10.3.1.0 on Windows 10 Professional 64 Bit and have an i7-4940-MX 3,1 GHz processor (4 cores).


ParallelTabledescription it says:ParallelTablewill give the same results asTable, except for side effects during the computation. May be something has to be specified withDistributedContexts? $\endgroup$ParallelEvaluateand$KernelIDare used? $\endgroup$