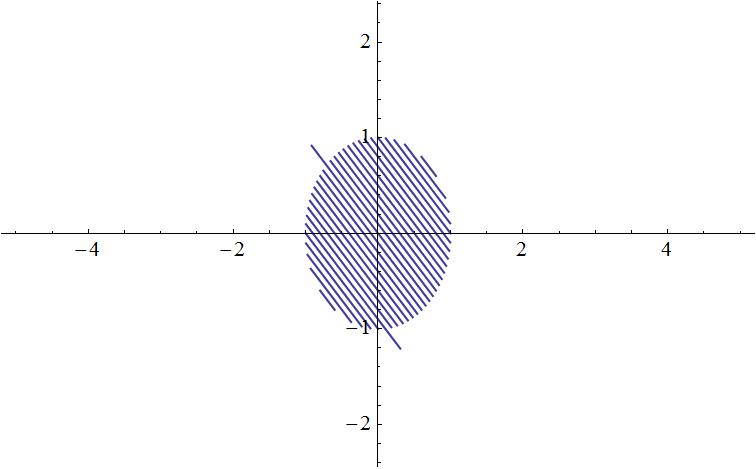
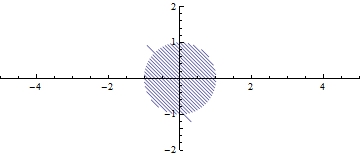
What is the problem with my plot? I want to get a disk shape.
Plot[Table[-x + k, {k, -2, 2, .1}], {x, -5 ,5},
  RegionFunction -> Function[{x, y}, (x^2 + y^2) < 1]]

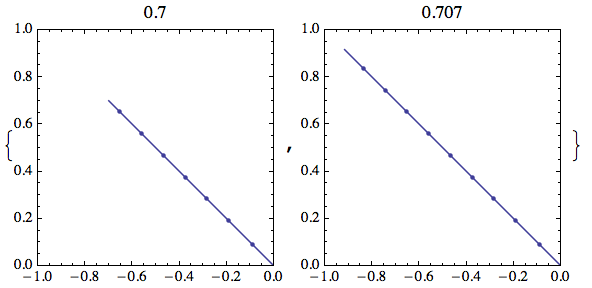
I think this is a bug. Here is a test with a single straight line and a RegionFunction that differs in its threshold only by .007:
Table[
 Plot[-x, {x, -5, 5},
  RegionFunction -> Function[{x, y}, y <= max],
  AspectRatio -> Automatic,
  PlotRange -> {{-1, 0}, {0, 1}},
  Frame -> True,
  Mesh -> True,
  PlotLabel -> max
  ],
 {max, {0.7, 0.707}}]

Both lines should be visually the same. The mesh points indicate that the function was repeatedly evaluated far outside the allowed region in the second plot, but nevertheless it didn't try to refine the location of the region boundary.
The problem is very sensitive to the choice of region boundary.
To work around it, you can either change the interval of x in the Plot command to something slightly bigger or smaller than $\pm 5$, or increase the number of PlotPoints as Silvia already pointed out.
Mathematica by default cannot always guess what humans find aesthetic. In your case, it assumes the standard aspect ratio of 1/GoldenRatio. Specifying a ratio of 1 though is not enough, as the plot ranges are still automatically selected by Mathematica to include most of the data (in this case, all). So to plot a correct shape, you have to give both options explicit values, and the aspect ratio must reflect the ratios of the $x$ and $y$ ranges.
Plot[Table[-x + k, {k, -2, 2, .1}], {x, -5, 5},
 PlotRange -> {{-5, 5}, {-2, 2}},
 AspectRatio -> 2/5,
 RegionFunction -> Function[{x, y}, (x^2 + y^2) < 1]]

AspectRatio -> Automatic.
$\endgroup$
Commented
Jun 7, 2013 at 7:01
Plot strange lines are still there but it can be easily fixed with PlotPoints like Sylvia has said.
$\endgroup$
{x, -2, 2}and settingAspectRatio -> Automatic. $\endgroup$RegionFunction. I told you to change the plotting range. You used{x, -5, 5}previously. $\endgroup$PlotPoints. $\endgroup$