0
$\begingroup$

I have a list with a collection of points of X and Y, I want to check how much the points act as a straight line. The number of points is not fixed between lists, so I would like to know how to do it in general and not a short list like 5 points.

In addition, the difference between the points is the parameter time. I would like to know if there is command that can display the straight line and the dots on it like manipulation.

$\endgroup$
2
  • $\begingroup$ Just a clarification: the structure of the list is: list = {{X1,Y1},{X2,Y2},....,{Xn,Yn}} with X1,...,Xn,Y1,...,Yn being numbers. Is that right? $\endgroup$
    – user49048
    Commented Mar 15, 2022 at 15:36
  • $\begingroup$ As a measure of how well some points lay on a line, you may use the "residuals", that is the differences between the y values and the y values of the line. As these have a sign, you may calculate the mean square. $\endgroup$ Commented Mar 15, 2022 at 16:01

1 Answer 1

2
$\begingroup$
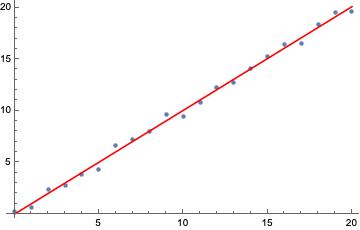
data = Table[{x, x + RandomReal[{-.8, .8}]}, {x, 0, 20}];
lm = LinearModelFit[data, x, x]

Show[ListPlot@data, Plot[lm[x], {x, 0, 20}, PlotStyle -> Red]]

enter image description here

$\endgroup$

Your Answer

By clicking “Post Your Answer”, you agree to our terms of service and acknowledge you have read our privacy policy.

Not the answer you're looking for? Browse other questions tagged or ask your own question.