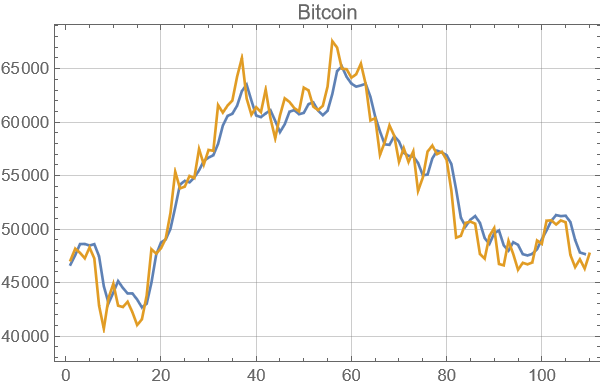
The following is 1,094 days (Length@btcData) of Bitcoin prices. Among them, data for the first 985 days (Length@btctrain) were used for training, and data for the last 109 days (Length@btctest) were used for testing. And the output graph compares the actual value with the predicted data for the last 109 days.
btc = TimeSeriesWindow[ResourceFunction["https://www.wolframcloud.com/obj/antononcube/DeployedResources/\Function/CryptocurrencyData"]["BTC"], {{2019, 1, 1}, {2022, 1, 1}}];
transformedbtc = Log /@ btc["Values"];  lag = 3;
btcData = Most[#] -> Last[#] & /@ (Partition[transformedbtc, lag + 1, 1]);
frac = Ceiling[Length[btcData]*0.9];
{btctrain, btctest} = {btcData[[;; frac]], btcData[[frac + 1 ;;]]};
model1 = NetChain[{ReshapeLayer[{1, lag}],
ConvolutionLayer[16, 2, "Input" -> {1, lag}],
PoolingLayer[2, "Function" -> Mean], LongShortTermMemoryLayer[50],
 BatchNormalizationLayer[], DropoutLayer[0.4], LinearLayer[64],
BatchNormalizationLayer[], DropoutLayer[0.2], LinearLayer[1]}];
btctrained1 = NetTrain[model1, btctrain, ValidationSet -> btctest, MaxTrainingRounds -> 300];
predictedbtc1 = btctrained1[Keys[btctest]];
predictedbtctransformed1 = Exp /@ predictedbtc1;
ListLinePlot[{predictedbtctransformed1, btc["Values"][[frac + lag ;;]]},
 PlotLegends -> {"Predicted", "Actual"}, PlotLabel -> "Bitcoin",
 GridLines -> Automatic, Frame -> True, ImageSize -> Medium]
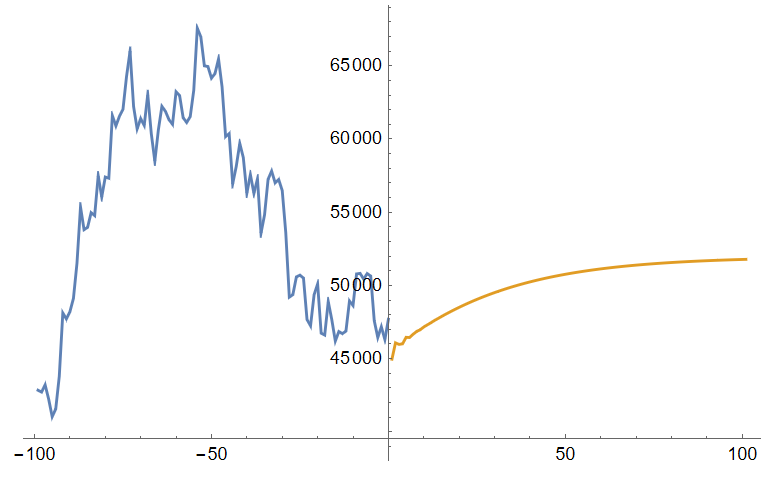
I wonder. I want to predict the bitcoin value for 30 days after the last day (Length@btcData=1,094 days). How should I correct it in the code above?


