1
$\begingroup$

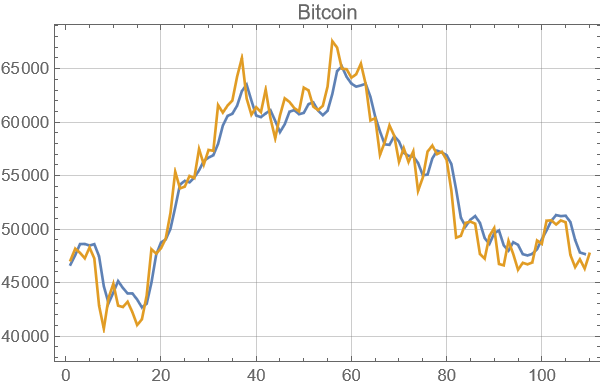
The following is 1,094 days (Length@btcData) of Bitcoin prices. Among them, data for the first 985 days (Length@btctrain) were used for training, and data for the last 109 days (Length@btctest) were used for testing. And the output graph compares the actual value with the predicted data for the last 109 days.

btc = TimeSeriesWindow[ResourceFunction["https://www.wolframcloud.com/obj/antononcube/DeployedResources/\Function/CryptocurrencyData"]["BTC"], {{2019, 1, 1}, {2022, 1, 1}}];
transformedbtc = Log /@ btc["Values"];  lag = 3; 
btcData = Most[#] -> Last[#] & /@ (Partition[transformedbtc, lag + 1, 1]);
frac = Ceiling[Length[btcData]*0.9];
{btctrain, btctest} = {btcData[[;; frac]], btcData[[frac + 1 ;;]]};
model1 = NetChain[{ReshapeLayer[{1, lag}], 
ConvolutionLayer[16, 2, "Input" -> {1, lag}], 
PoolingLayer[2, "Function" -> Mean], LongShortTermMemoryLayer[50],
 BatchNormalizationLayer[], DropoutLayer[0.4], LinearLayer[64], 
BatchNormalizationLayer[], DropoutLayer[0.2], LinearLayer[1]}];
btctrained1 = NetTrain[model1, btctrain, ValidationSet -> btctest, MaxTrainingRounds -> 300];
predictedbtc1 = btctrained1[Keys[btctest]];
predictedbtctransformed1 = Exp /@ predictedbtc1;
ListLinePlot[{predictedbtctransformed1, btc["Values"][[frac + lag ;;]]}, 
 PlotLegends -> {"Predicted", "Actual"}, PlotLabel -> "Bitcoin", 
 GridLines -> Automatic, Frame -> True, ImageSize -> Medium]

enter image description here

I wonder. I want to predict the bitcoin value for 30 days after the last day (Length@btcData=1,094 days). How should I correct it in the code above?

$\endgroup$
3
  • $\begingroup$ Nice question. 1+.I waiting for answers,because it will also be useful to me. $\endgroup$ Commented Mar 15, 2022 at 8:09
  • $\begingroup$ Actually, there is no any model to predict price even for one day. :) $\endgroup$ Commented Mar 15, 2022 at 8:34
  • 1
    $\begingroup$ In general, the future is non-deterministic. In practice, there are some aspects of the future that are correlated with past and present; but for a good prediction you may need to know many more parameters of past and present than just the one you are trying to predict. This question would be better suited for the philosophy stackexchange. $\endgroup$
    – Roman
    Commented Mar 15, 2022 at 9:47

1 Answer 1

1
$\begingroup$

I will only answer your question about the prediction and let someone else explain how and why your model likely won't meet your expectations.

Your neural net is a function that maps $n$ (lag) previous prices $p$ to the price at time $t$: $$\left( p(t-n), p(t-n+1), \dots, p(t-2), p(t-1) \right) \mapsto p(t).$$

Therefore, to construct the future prediction, you have to go step-by-step, taking $n$ previous results and predicting one new value at a time. This can be easily done with NestList.

numPrevious = 100;
numNew = 100;

prediction = 
  Exp@*Last /@ 
   NestList[Rest[#]~Join~{btctrained1[#]} &, 
    transformedbtc[[frac ;; frac + lag - 1]], numNew];
previous = 
  Transpose[{Range[-numPrevious + 1, 0], 
    Exp@transformedbtc[[-numPrevious ;; -1]]}];

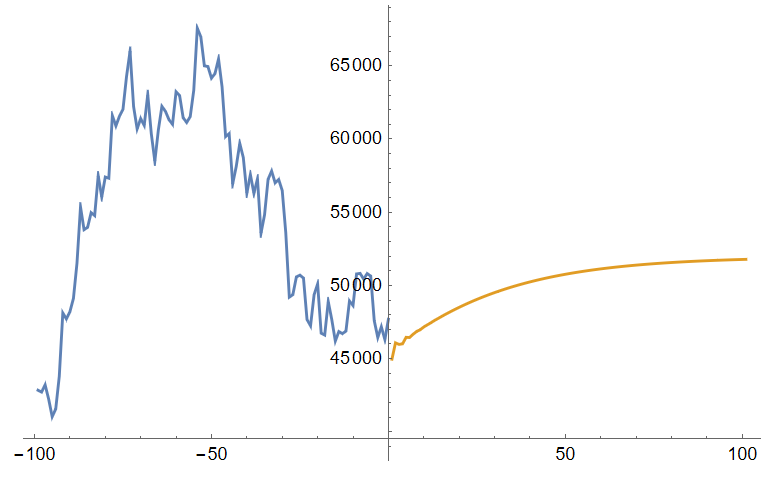
ListLinePlot[{previous, prediction}]

Prediction

$\endgroup$
2
  • $\begingroup$ For me prediction is very off, too very smooth. :( $\endgroup$ Commented Mar 15, 2022 at 16:04
  • 1
    $\begingroup$ thanks for your answer. The predicted value converges to a certain value. These predictions are so different from reality. Of course I understand. This may be because the following is predicted with the previous 3 (=lag) data. So, is there a better way to solve these limitations? $\endgroup$
    – Milk
    Commented Mar 15, 2022 at 23:02

Your Answer

By clicking “Post Your Answer”, you agree to our terms of service and acknowledge you have read our privacy policy.

Not the answer you're looking for? Browse other questions tagged or ask your own question.