3
$\begingroup$

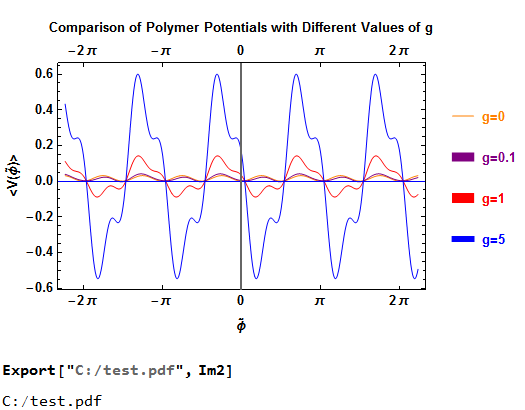
I have changed the width of the plots in my code but whenever I save it as a pdf file, it appears that the legend specifying each plot has a thin width as compared to the lines in the plot. Following is my code:(I have seen similar questions but they didn't work for me. I am using Mathematica 9.0.)

go = ((0.25*g*
    M^3)*((Cos[3*\[Phi]/M]*Exp[-(9/4)/(sig^2*M^2)]) - (3*
      Sin[\[Phi]/M]*Exp[-0.25/(sig^2*M^2)]))) + 
M^2*m^2*0.25*(1 - Cos[2*\[Phi]/M]*Exp[-1/(M^2*sig^2)]) /. {M -> 
 0.5, m -> 0.5, sig -> 20, g -> 0};

g2 = ((0.25*g*
        M^3)*((Cos[3*\[Phi]/M]*Exp[-(9/4)/(sig^2*M^2)]) - (3*
          Sin[\[Phi]/M]*Exp[-0.25/(sig^2*M^2)]))) + 
    M^2*m^2*0.25*(1 - Cos[2*\[Phi]/M]*Exp[-1/(M^2*sig^2)]) /. {M -> 
     0.5, m -> 0.5, sig -> 20, g -> 0.1};
g3 = ((0.25*g*
        M^3)*((Cos[3*\[Phi]/M]*Exp[-(9/4)/(sig^2*M^2)]) - (3*
          Sin[\[Phi]/M]*Exp[-0.25/(sig^2*M^2)]))) + 
    M^2*m^2*0.25*(1 - Cos[2*\[Phi]/M]*Exp[-1/(M^2*sig^2)]) /. {M -> 
     0.5, m -> 0.5, sig -> 20, g -> 1};
g4 = ((0.25*g*
        M^3)*((Cos[3*\[Phi]/M]*Exp[-(9/4)/(sig^2*M^2)]) - (3*
          Sin[\[Phi]/M]*Exp[-0.25/(sig^2*M^2)]))) + 
    M^2*m^2*0.25*(1 - Cos[2*\[Phi]/M]*Exp[-1/(M^2*sig^2)]) /. {M -> 
     0.5, m -> 0.5, sig -> 20, g -> 5};
Im2 = Plot[{go, g2, g3, g4}, {\[Phi], -7, 7}, 
  FrameTicks -> {Range[-6*Pi, 6*Pi, Pi], Automatic}, 
  PlotRange -> {All, All}, 
  PlotStyle -> {{Yellow, Thickness[0.005]}, {Purple, 
     Thickness[0.005]}, {Red, Thickness[0.005]}, {Blue, 
     Thickness[0.005]}}, Frame -> True, 
  AxesStyle -> {Blue, Thickness[0.006]}, 
  FrameStyle -> Directive[Black], 
  FrameLabel -> {{"<V(\!\(\*OverscriptBox[\(\[Phi]\), \(~\)]\))>", 
     None}, {"\!\(\*OverscriptBox[\(\[Phi]\), \(~\)]\)", 
     "Comparison of Polymer Potentials with Different Values of g"}}, 
  LabelStyle -> {Bold, FontSize -> 11}, 
  PlotLegends -> {Style["g=0", 11, Bold], Style["g=0.1", 11, Bold], 
    Style["g=1", 11, Bold], Style["g=5", 11, Bold]}]
$\endgroup$
2
  • $\begingroup$ How did you export it to PDF? I tried a few different ways from a notebook and it seemed to work ok (MMA 12.2 Win10-64bit). MMA 9 is obsolete now and has been for a while, so it may also be the case that the newer versions have fixed the problem you have. $\endgroup$
    – MarcoB
    Commented Mar 1, 2022 at 14:51
  • $\begingroup$ I used the following command: {Export["filename.pdf", Show[plot], ImageResolution -> 300]} $\endgroup$
    – Jpmg
    Commented Mar 1, 2022 at 15:21

1 Answer 1

3
$\begingroup$
go = ((0.25*g*
        M^3)*((Cos[3*\[Phi]/M]*Exp[-(9/4)/(sig^2*M^2)]) - (3*
          Sin[\[Phi]/M]*Exp[-0.25/(sig^2*M^2)]))) + 
    M^2*m^2*0.25*(1 - Cos[2*\[Phi]/M]*Exp[-1/(M^2*sig^2)]) /. {M -> 
     0.5, m -> 0.5, sig -> 20, g -> 0};

g2 = ((0.25*g*
        M^3)*((Cos[3*\[Phi]/M]*Exp[-(9/4)/(sig^2*M^2)]) - (3*
          Sin[\[Phi]/M]*Exp[-0.25/(sig^2*M^2)]))) + 
    M^2*m^2*0.25*(1 - Cos[2*\[Phi]/M]*Exp[-1/(M^2*sig^2)]) /. {M -> 
     0.5, m -> 0.5, sig -> 20, g -> 0.1};
g3 = ((0.25*g*
        M^3)*((Cos[3*\[Phi]/M]*Exp[-(9/4)/(sig^2*M^2)]) - (3*
          Sin[\[Phi]/M]*Exp[-0.25/(sig^2*M^2)]))) + 
    M^2*m^2*0.25*(1 - Cos[2*\[Phi]/M]*Exp[-1/(M^2*sig^2)]) /. {M -> 
     0.5, m -> 0.5, sig -> 20, g -> 1};
g4 = ((0.25*g*
        M^3)*((Cos[3*\[Phi]/M]*Exp[-(9/4)/(sig^2*M^2)]) - (3*
          Sin[\[Phi]/M]*Exp[-0.25/(sig^2*M^2)]))) + 
    M^2*m^2*0.25*(1 - Cos[2*\[Phi]/M]*Exp[-1/(M^2*sig^2)]) /. {M -> 
     0.5, m -> 0.5, sig -> 20, g -> 5};
Im2 = Plot[{go, g2, g3, g4}, {\[Phi], -7, 7}, 
  FrameTicks -> {Range[-6*Pi, 6*Pi, Pi], Automatic}, 
  PlotRange -> {All, All}, 
  PlotStyle -> {{Orange, Thickness[0.005]}, {Purple, 
     Thickness[0.005]}, {Red, Thickness[0.005]}, {Blue, 
     Thickness[0.005]}}, Frame -> True, 
  AxesStyle -> {Blue, Thickness[0.006]}, 
  FrameStyle -> Directive[Black], 
  FrameLabel -> {{"<V(\!\(\*OverscriptBox[\(\[Phi]\), \(~\)]\))>", 
     None}, {"\!\(\*OverscriptBox[\(\[Phi]\), \(~\)]\)", 
     "Comparison of Polymer Potentials with Different Values of g"}}, 
  LabelStyle -> {Bold, FontSize -> 11}
  ,
  PlotLegends -> LineLegend[
    {
     Directive[Thickness[0.005], Orange]
     , Directive[Thickness[0.04], Purple]
     , Directive[Thickness[0.05], Red]
     , Directive[Thickness[0.02], Blue]
     }
    ,
    {
     Style["g=0", 11, Bold, Orange]
     , Style["g=0.1", 11, Bold, Purple]
     , Style["g=1", 11, Bold, Red]
     , Style["g=5", 11, Bold, Blue]
     }
    , LegendMarkerSize -> {{20, 25}}
    ]
  ]

enter image description here

I took a few liberties with the Style and LegendMarkerSize that you can modify as required.

$\endgroup$
1
  • $\begingroup$ Thank you so much Syed. It will help. $\endgroup$
    – Jpmg
    Commented Mar 1, 2022 at 15:14

Your Answer

By clicking “Post Your Answer”, you agree to our terms of service and acknowledge you have read our privacy policy.

Not the answer you're looking for? Browse other questions tagged or ask your own question.