0
$\begingroup$

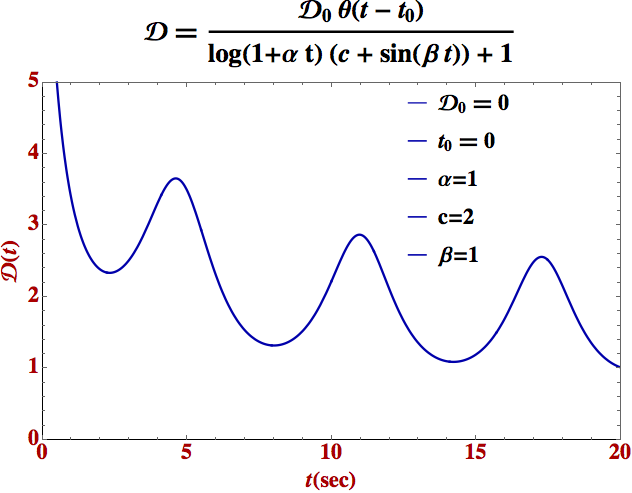
How can I add the legend in a plot, INSIDE the plot (as in the figure below), but in a way that they are arranged in row and not in column?

What I have done so far:

Plot[{d[10, 1, 1, 2, t, 0], , , ,}, {t, 0, 20}, PlotRange -> {0, 5}, 
LabelStyle -> {FontSize -> 22, FontFamily -> "Times", Black, Bold}, 
PlotStyle -> {{Darker[Blue], 
Thickness[0.004]}, {Darker[Blue]}, {Darker[Blue]}, {Darker[
Blue]}, {Darker[Blue]}}, PlotRangePadding -> 0, 
LabelStyle -> {FontSize -> 13}, AxesStyle -> Bold, Frame -> True, 
FrameLabel -> {t [sec], \[ScriptCapitalD][t]}, 
LabelStyle -> {FontSize -> 13}, AxesStyle -> Bold, 
FrameStyle -> {{Directive[FontColor -> Darker[Red]], 
Automatic}, {Directive[FontColor -> Darker[Red]], Automatic}}, 
PlotLabel -> \[ScriptCapitalD] == 
Subscript[\[ScriptCapitalD], 
 0] \[Theta][
  t - Subscript[t, 0]]/(1 + 
   Log["1+\[Alpha] t"] (c + Sin[\[Beta] t])), 
PlotLegends -> 
Placed[{Subscript[\[ScriptCapitalD], 0] == 0, Subscript[t, 0] == 0, 
"\[Alpha]=1", "c=2", "\[Beta]=1"}, {0.3, 0.3}]]

enter image description here

Also, every improvement you would like to tell me, just tell me!

$\endgroup$

1 Answer 1

1
$\begingroup$

Try with LineLegend combined with LegendLayout -> "Row":

Plot[{d[10, 1, 1, 2, t, 0], , , ,}, {t, 0, 20}, PlotRange -> {0, 5}, 
 LabelStyle -> {FontSize -> 22, FontFamily -> "Times", Black, Bold}, 
 PlotStyle -> {{Darker[Blue], 
    Thickness[0.004]}, {Darker[Blue]}, {Darker[Blue]}, {Darker[
     Blue]}, {Darker[Blue]}}, PlotRangePadding -> 0, 
 LabelStyle -> {FontSize -> 13}, AxesStyle -> Bold, Frame -> True, 
 FrameLabel -> {t[sec], \[ScriptCapitalD][t]}, 
 LabelStyle -> {FontSize -> 13}, AxesStyle -> Bold, 
 FrameStyle -> {{Directive[FontColor -> Darker[Red]], 
    Automatic}, {Directive[FontColor -> Darker[Red]], Automatic}}, 
 PlotLabel -> \[ScriptCapitalD] == 
   Subscript[\[ScriptCapitalD], 
     0] \[Theta][
      t - Subscript[t, 0]]/(1 + 
       Log["1+\[Alpha] t"] (c + Sin[\[Beta] t])), 
 PlotLegends -> 
  Placed[LineLegend[{Subscript[\[ScriptCapitalD], 0] == 0, 
     Subscript[t, 0] == 0, "\[Alpha]=1", "c=2", "\[Beta]=1"}, 
    LegendLayout -> "Row"], {0.3, 0.3}]
 ]

EDIT: for changing the markers, use PointLegend instead of LineLegend combined with LegendMarkers option:

Plot[{d[10, 1, 1, 2, t, 0], , , ,}, {t, 0, 20}, PlotRange -> {0, 5}, 
 LabelStyle -> {FontSize -> 22, FontFamily -> "Times", Black, Bold}, 
 PlotStyle -> {{Darker[Blue], 
    Thickness[0.004]}, {Darker[Blue]}, {Darker[Blue]}, {Darker[
     Blue]}, {Darker[Blue]}}, PlotRangePadding -> 0, 
 LabelStyle -> {FontSize -> 13}, AxesStyle -> Bold, Frame -> True, 
 FrameLabel -> {t[sec], \[ScriptCapitalD][t]}, 
 LabelStyle -> {FontSize -> 13}, AxesStyle -> Bold, 
 FrameStyle -> {{Directive[FontColor -> Darker[Red]], 
    Automatic}, {Directive[FontColor -> Darker[Red]], Automatic}}, 
 PlotLabel -> \[ScriptCapitalD] == 
   Subscript[\[ScriptCapitalD], 
     0] \[Theta][
      t - Subscript[t, 0]]/(1 + 
       Log["1+\[Alpha] t"] (c + Sin[\[Beta] t])), 
PlotLegends -> 
  Placed[PointLegend[{Subscript[\[ScriptCapitalD], 0] == 0, 
     Subscript[t, 0] == 0, "\[Alpha]=1", "c=2", "\[Beta]=1"}, 
    LegendMarkers -> {"\[FilledDiamond]", "\[FilledCircle]", 
      "\[FilledSquare]", "\[CircleTimes]"}, 
    LegendLayout -> "Row"], {0.3, 0.3}]]
$\endgroup$
3
  • $\begingroup$ PERFECT. Thank you so much! $\endgroup$
    – Enrico M.
    Commented Jun 22, 2018 at 9:14
  • $\begingroup$ Another question, if I don't bother you: is there a way to change the "bars" before the values of the constants into points, or stars or other shapes? $\endgroup$
    – Enrico M.
    Commented Jun 22, 2018 at 9:16
  • 1
    $\begingroup$ Sure, see edits. $\endgroup$
    – Fraccalo
    Commented Jun 22, 2018 at 9:24

Your Answer

By clicking “Post Your Answer”, you agree to our terms of service and acknowledge you have read our privacy policy.

Not the answer you're looking for? Browse other questions tagged or ask your own question.