I'm trying to solve the Helmholtz equation :
https://en.wikipedia.org/wiki/Helmholtz_equation in a 3d space, in vacuum, using FEM.
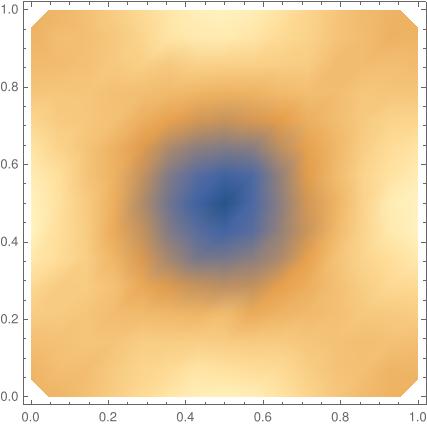
I expect the solution to be an function oscillating in the x direction, invariant in y and z, but my Mathematica code provides an unexpected solution.
Needs["NDSolve`FEM`"]
λ = 0.7; k0 = 2 π/λ; c = 3*10^8;
xMax = 5*λ;
Ω =
  ImplicitRegion[True, {{x, 0, xMax}, {y, 0, 1}, {z, 0, 1}}];
mesh = ToElementMesh[Ω, MaxCellMeasure -> 0.0001];
Γ =
  DirichletCondition[{exField[x, y, z] == 0, eyField[x, y, z] == 0,
    ezField[x, y, z] == 1}, x == 0 || x == xMax];
pbc1 = PeriodicBoundaryCondition[ezField[x, y, z], y == 0,
   Function[y, y + {0, 1, 0}]];
pbc2 = PeriodicBoundaryCondition[ezField[x, y, z], z == 0,
   Function[z, z + {0, 0, 1}]];
op = Laplacian[{exField[x, y, z], eyField[x, y, z],
     ezField[x, y, z]}, {x, y, z}] + (k0^2)*{exField[x, y, z],
     eyField[x, y, z], ezField[x, y, z]};
{exFieldS, eyFieldS, ezFieldS} =
 NDSolveValue[{op == {0, 0, 0}, Γ, pbc1,
   pbc2}, {exField, eyField, ezField}, {x, y, z} ∈ mesh,
  Method -> "FiniteElement"]
I launch the wave using Dirichlet condition for the ezField on the left (x=0). I add PeriodicBoundaryCondition from the symmetry of the problem. The two other fields are not useful yet.
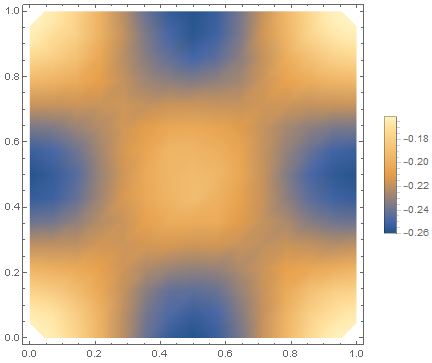
I expect to have a constant amplitude for a given x when plotting the z field but
DensityPlot[ezFieldS[3, y, z], {y, 0, 1}, {z, 0, 1}, AspectRatio -> Automatic, PlotLegends ->Automatic, AxesLabel -> {"y", "z"}]]
Returns a non constant plane
My code is similar to Solution of electromagnetic wave in frequency domain seems strange but I use the v12.1 of Mathematica and therefore I don't think the issue is the same.
Why isn't my output a plane wave ?
Edit : changing the boundary conditions of ez to Dirichlet E[I k0 x] on all surfaces gives a better result. I still do not unerstand why the output of the previous code is not correct.


