17
$\begingroup$

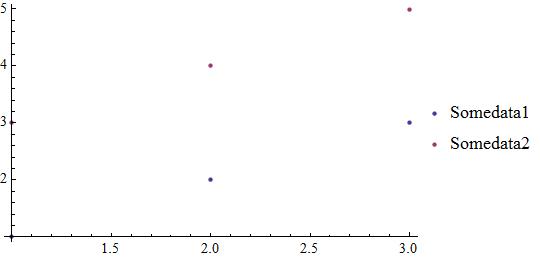
I am creating some plots with Show but unfortunately the PlotLegends seems to be out of the bounding box when saving the graph.

Sample code:

data1 = {1, 2, 3};
data2 = {3, 4, 5};
Show[ListPlot[data1, PlotLegends -> {"Somedata1"}], 
ListPlot[data2, PlotLegends -> {"Somedata2"}]]

Is there a way to include them so they can be exported along with the image?

$\endgroup$
5
  • $\begingroup$ @YvesKlett, ill fix that straight away. $\endgroup$
    – JavaCake
    Commented May 24, 2013 at 7:28
  • $\begingroup$ @YvesKlett, went a tad too quick. It should be fixed now. $\endgroup$
    – JavaCake
    Commented May 24, 2013 at 7:36
  • $\begingroup$ If you want to export it as a raster image, you can always use Rasterize. $\endgroup$ Commented May 24, 2013 at 9:10
  • $\begingroup$ Have you tried the legendMaker and the autoLegend functions in this post? It works perfectly for me and is the best solution for legends in MMA I've ever discovered on this site. $\endgroup$
    – Leo Fang
    Commented Jun 19, 2013 at 1:08
  • 1
    $\begingroup$ Actually, you can use Export command to export your result as a picture such that Export["test.jpg",(*your result*)]. By this way the legend is included. $\endgroup$
    – Z-Y.L
    Commented Feb 17, 2014 at 5:57

5 Answers 5

14
$\begingroup$
data1 = RandomReal[10, {10}];
data2 = RandomReal[10, {10}];
Show[ListPlot[data1, PlotLegends -> Placed[{"Somedata1"}, {1, .5}]], 
ListPlot[data2, PlotLegends -> Placed[{"Somedata2"}, {1, .4}]]]

For different colors, just one ListPlot is enough sometimes.

ListPlot[{data1,data2},PlotLegends->Placed[{"Somedata1","Somedata2"},{1,.5}]]

enter image description here

$\endgroup$
3
$\begingroup$

I have found a way of making a pdf or eps file from a Plot with a Legend. Click on the plot till everything is selected, including the legends. Then save it a a pdf or eps file.... and that is it.

$\endgroup$
0
$\begingroup$

Instead of Show[], you should use all the data set in a single Plot[] (for your case it is ListPlot[]). It will automatically assign different Style or PlotMarker to distinguish different plots. And you can always put the legend at your desired position. As an example

data1 = Table[{x, Sin[x]}, {x, 0, 2 Pi, .1}]; label1 = "Sine";
data2 = Table[{x, Cos[x]}, {x, 0, 2 Pi, .1}]; label2 = "Cosine";

Needs["PlotLegends`"]
position = {0.25, 0.25};
size = {0.3, 0.2};
ListPlot[{data1, data2}, PlotStyle -> {Black, Red}, PlotLegend -> {label1, label2}, LegendShadow -> None, LegendBorder -> Automatic, LegendSize -> size, LegendPosition -> position]

You can easily vary the position of your Legend and in will be in the same place in exported file as well.

$\endgroup$
0
$\begingroup$

With "Export " you can export the graph to the currect directory or another directory.

data1 = {1, 2, 3};
data2 = {3, 4, 5};
g = Show[ListPlot[data1, PlotLegends -> {"Somedata1"}], 
  ListPlot[data2, PlotLegends -> {"Somedata2"}]]

currentdirectory = NotebookDirectory[]
Export[currentdirectory <> "/mylistplot.pdf", g]
$\endgroup$
0
$\begingroup$

Using Show[] as in your example code, you can also right-click on the output cell bracket (on the right of your nb) -> Save selection as -> your desired filetype (e.g. .svg, .pdf). This will also include the PlotLegends.

$\endgroup$

Your Answer

By clicking “Post Your Answer”, you agree to our terms of service and acknowledge you have read our privacy policy.

Not the answer you're looking for? Browse other questions tagged or ask your own question.