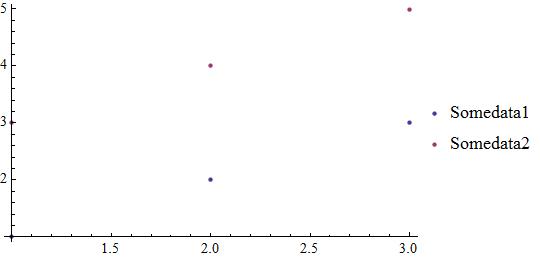
Instead of Show[], you should use all the data set in a single Plot[] (for your case it is ListPlot[]). It will automatically assign different Style or PlotMarker to distinguish different plots. And you can always put the legend at your desired position. As an example
data1 = Table[{x, Sin[x]}, {x, 0, 2 Pi, .1}]; label1 = "Sine";
data2 = Table[{x, Cos[x]}, {x, 0, 2 Pi, .1}]; label2 = "Cosine";

Needs["PlotLegends`"]
position = {0.25, 0.25};
size = {0.3, 0.2};
ListPlot[{data1, data2}, PlotStyle -> {Black, Red}, PlotLegend -> {label1, label2}, LegendShadow -> None, LegendBorder -> Automatic, LegendSize -> size, LegendPosition -> position]
You can easily vary the position of your Legend and in will be in the same place in exported file as well.


Rasterize. $\endgroup$legendMakerand theautoLegendfunctions in this post? It works perfectly for me and is the best solution for legends in MMA I've ever discovered on this site. $\endgroup$Exportcommand to export your result as a picture such thatExport["test.jpg",(*your result*)]. By this way the legend is included. $\endgroup$