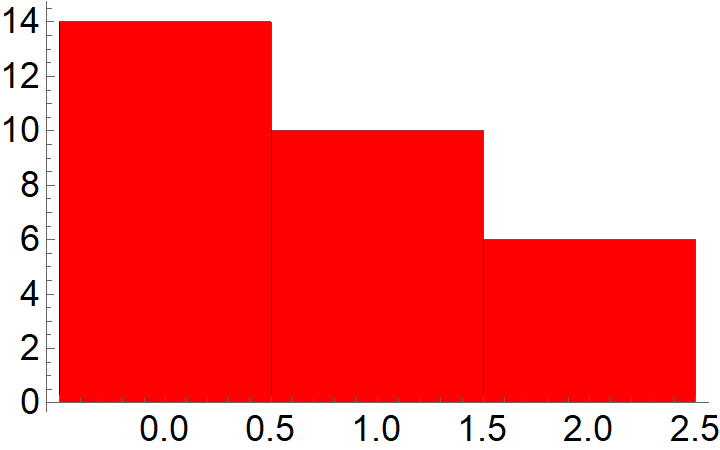
If I have histogram as
Labeled[Histogram[{0, 0, 0, 0, 0, 0, 0, 0, 0, 0, 0, 0, 0, 0, 1,
                   1, 1, 1, 1, 1, 1, 1, 1, 1, 2, 2, 2, 2, 2, 2},
   ChartStyle -> Red, LabelStyle -> {18, GrayLevel[0]}],
   {Rotate[Style["Number of cities", FontFamily -> "Times"], 90 Degree],
   Style["Number of crimes", FontFamily -> "Times"]}, {Left, Bottom},
   LabelStyle -> {18, GrayLevel[0]}]
How can I add error bars, let's say: $0.5$, $0.4$, and $0.3$, using Around command?


Histogram. You can probably build your own histogram usingBarChartandBinCounts, where you can useAroundto specify error bars. Alternatively, you can keep the histogram and useListPlotandBinCountsto genereate the error bars, which you could the combine with the histogram usingShow$\endgroup$