I have a matrix of data that I am plotting via ArrayPlot.
FData = {{0., 0., 0.066812, 0., 0., 0., 0.}, {0., 0.479787, 0.,
   0.0683112, 0., 0., 0.}, {0.0669646, 0., 0.0697005, 0., 0., 0.,
   0.}, {0., 0.0683715, 0., 0., 0., 0., 0.}, {0., 0., 0., 0., 0., 0.,
   0.}, {0., 0., 0., 0., 0., 0., 0.}, {0., 0., 0., 0., 0., 0., 0.}}
I would like to reverse the color bar colors in the Plot legend. I used:
ArrayPlot[
 FData,
 PlotLegends ->
  BarLegend[{GrayLevel, {0, Max[FData]}},
   LabelStyle -> {FontSize -> 20}], DataReversed -> False]
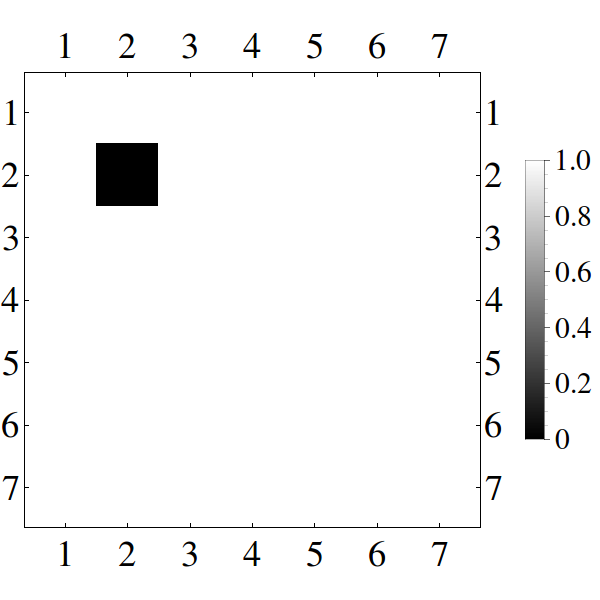
And this gives me:

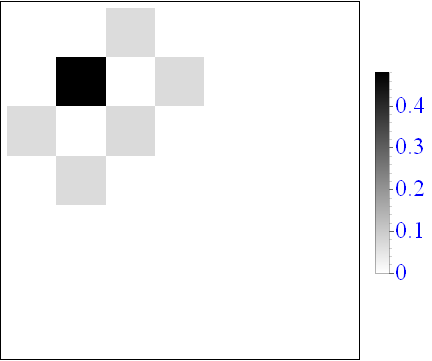
The colors are flipped in this figure and I'd like the darkest to represent the highest number in my matrix.
When I try to "Reverse" my data (which doesn't seem sound to me) using the below snippet:
FData[[1 ;; 7, 1 ;; 7]]
ArrayPlot[
 FData[[1 ;; 7, 1 ;; 7]],
 PlotLegends ->
  BarLegend[{GrayLevel, {0, Reverse[FData[[1 ;; 7, 1 ;; 7]]]}},
   LabelStyle -> {FontSize -> 20}], DataReversed -> False]
And that gives me nothing!
Edit/Errata
I have been using PlotLegends ->
BarLegend[{GrayLevel, {0, 1}}, LabelStyle -> {FontSize -> 20}] to set the font size. Based on the answers below, how can I go about changing the font size?
I know this is very basic but I can't quite figure out whats going on!


