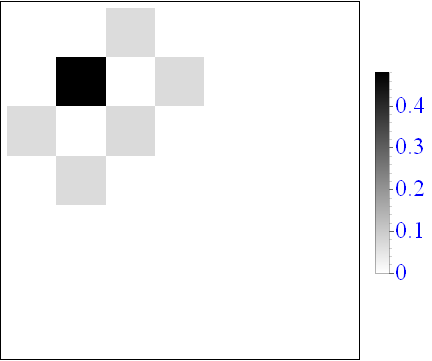
ArrayPlot[FData, ColorFunction -> Function[With[{z},g = GrayLevel[1 - z]],#] &},
       ArrayPlot[FData, ColorFunction -> g, PlotLegends -> BarLegend[{GrayLevel[1 - #] &g, {Min@FData, Max@FData}},
                                    LabelStyle -> Directive[Blue, Large]]]Large]]]]


