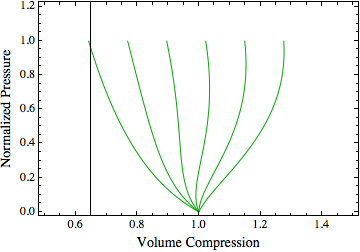
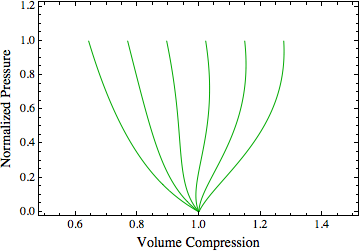
I have seen this strange plotting artifact occur before and I was able to make it go away by changing the PlotRange. However, this time I need the prescribed PlotRange to be what I define and I get a strange vertical line within my plot.
The questions are, "What causes this?" and "How do I prevent it from happening?" This is happening for me in Version 9.0 on Mac and Windows.
Here is the code:
ur[x_, a_] := 1 - (1/a) Log[1 + a x]
g[x_, go_, s_, m_] := 1/2 (go x Exp[-(x/s)])/(1 + m x)
uh[x_, a_, go_, s_, m_, k_] := ur[x, a] + g[x, go, s, m]/(1 - g[x, go, s, m]) (k - 1)

a = 5; go = 1; s = 2; m = 0.5;

plt[k_] := ParametricPlot[{ uh[x, a, go, s, m, k], x}, {x, 0, 1},
           AspectRatio -> 1/1.5, Frame -> True, PlotStyle -> {Darker[Green]},
           FrameLabel -> {Style["Volume Compression", 14],
           Style["Normalized Pressure", 14]},
           LabelStyle -> {FontSize -> 12, FontFamily -> "Times"}]

Show[Table[plt[k], {k, 1.0, 3.5, 0.5}], PlotRange -> {{0.5, 1.5}, {0, 1.2}}]
The resulting graphic is produced with the line artifact at x=0.65. Not certain as to why this happens. If I tweak the PlotRange to PlotRange -> {{0.6, 1.4}, {0, 1.2}} the line goes away. However, I need the PlotRange to be PlotRange -> {{0.5, 1.5}, {0, 1.2}}. If I move the PlotRange into the ParametricPlot function I get the same result.

Thanks in advance for any assistance...

