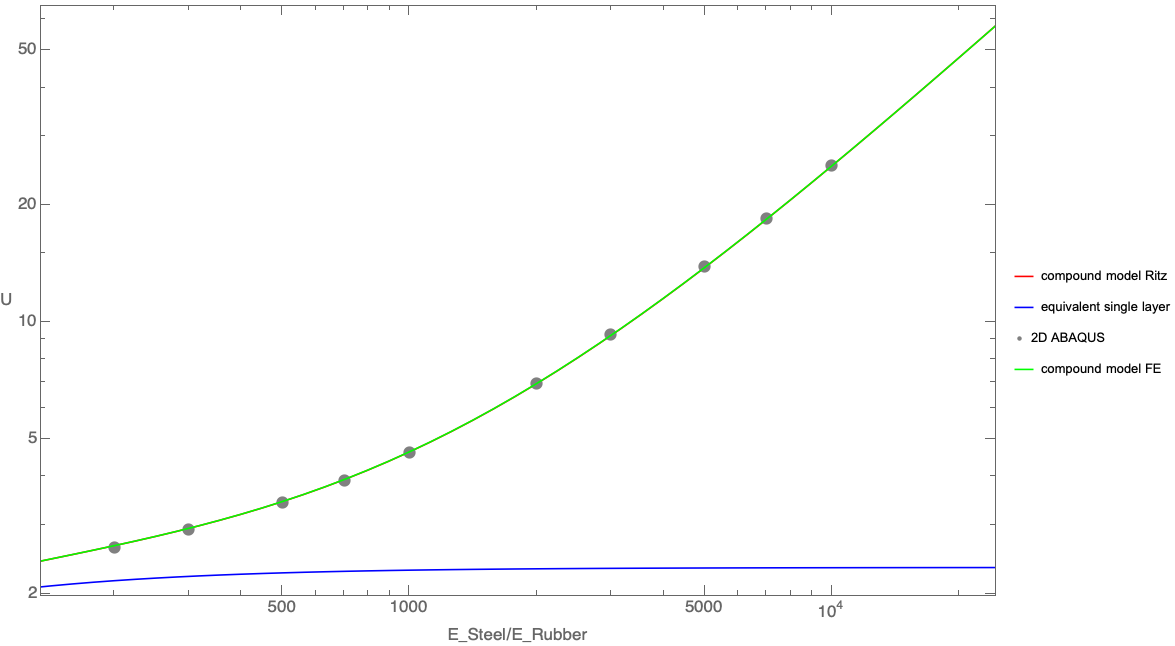
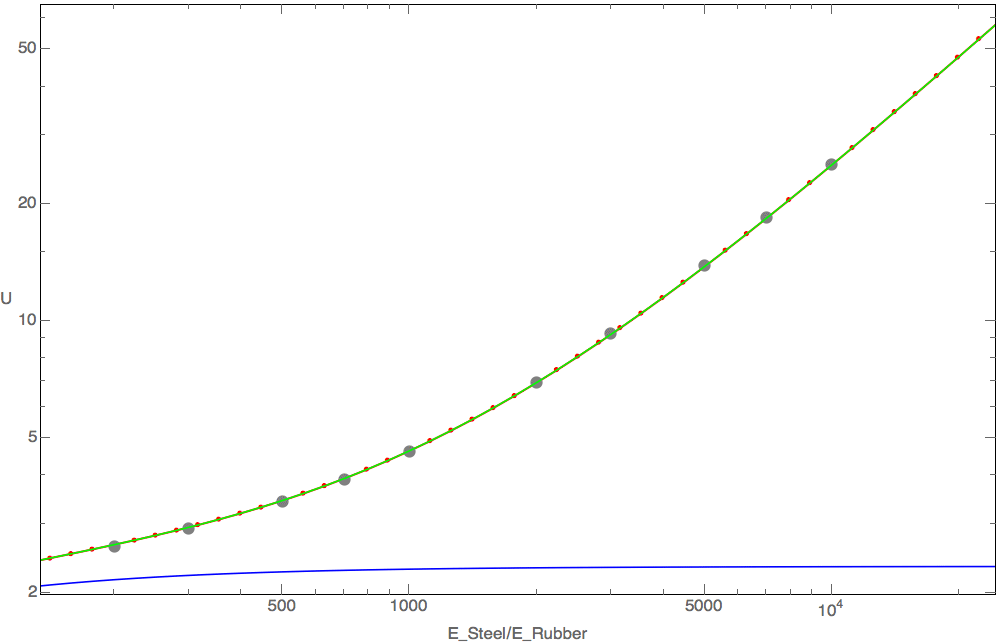
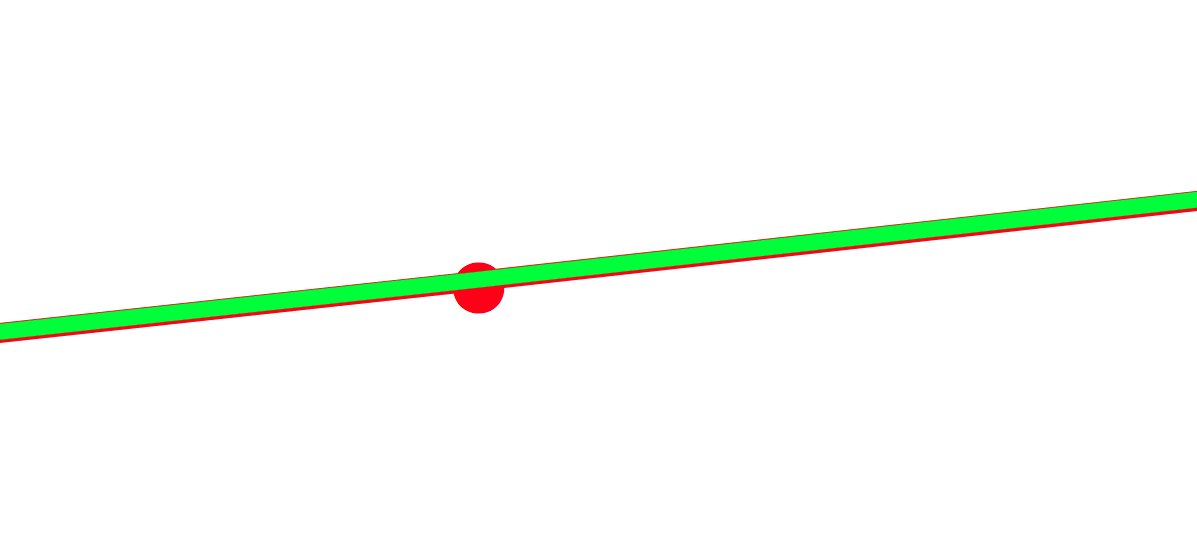
I have a plot that I made with the help of the show function. But I need to zoom in on this plot I tried once but it is not enough I need to zoom until I see the difference between gray dots green line and red line but unfortunately I can not do it is there any idea how to do it? p1 p2 p4 p5 are plots of some results!
 p8 = Show[{p1, p2, p4, p5}, Frame -> True, FrameLabel -> {"E_Steel/E_Rubber", "U"}, RotateLabel -> False,
  Axes -> False,
  FrameStyle -> Directive[FontSize -> 17, FontFamily -> "Helvetica"],
  PlotRange -> {{5, 10}, {0.75, 4}}, ImageSize -> 1000]
Export["EnergieZoomed.png", p8]


p1,p2,p3,p4. $\endgroup$