deleted 6 characters in body
Source Link
Alrubaie
  • 1.1k
  • 6
  • 14

First of all your p1 is not clear in graph despite i used Magnification.

So edit your p1 to be like this. you still can make Style no Thick

p1 = ListLogLogPlot[UvaluesAgainstYSteeltoYRubber, 
  AxesLabel -> {"E_Steel/e_Rubber", "U"}, PlotStyle -> {Thick, Red}, 
  PlotMarkers -> Automatic, 
     Joined -> True, PlotLegends -> {"compound model Ritz"}]

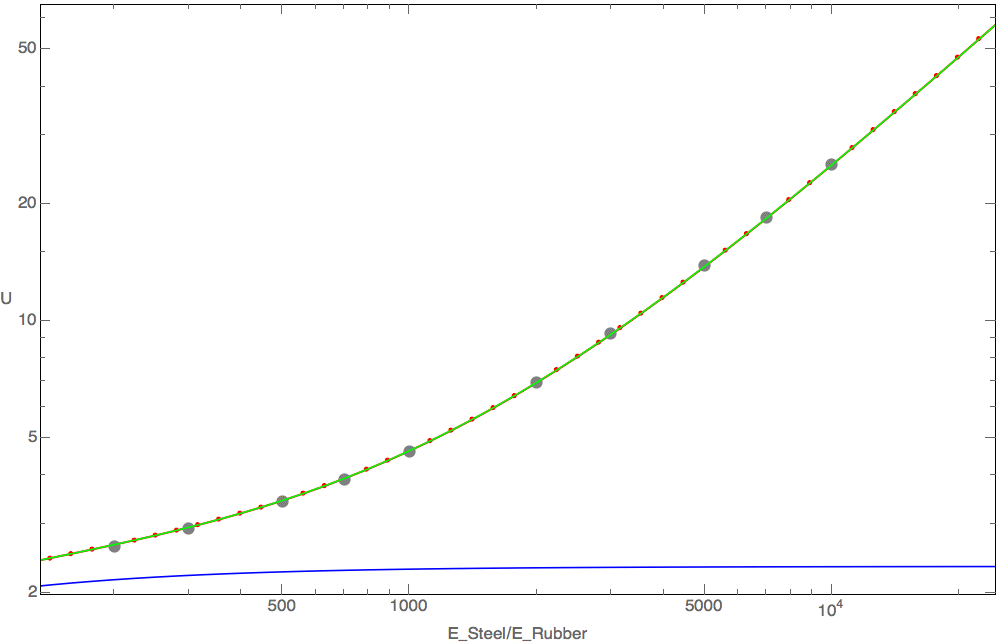
Now as you see that in p8 Show, its there !!!

enter image description here

Now go ahead use little value of Magnify

Magnify[p8, 5]

enter image description here

Actually your Data and Curves are truly fitted on each other. Its means you are so pro Brother in what ever experiment is this !Actually your Data and Curves are truly fitted on each other. Its means you are so pro in what ever experiment is this !

First of all your p1 is not clear in graph despite i used Magnification.

So edit your p1 to be like this. you still can make Style no Thick

p1 = ListLogLogPlot[UvaluesAgainstYSteeltoYRubber, 
  AxesLabel -> {"E_Steel/e_Rubber", "U"}, PlotStyle -> {Thick, Red}, 
  PlotMarkers -> Automatic, 
     Joined -> True, PlotLegends -> {"compound model Ritz"}]

Now as you see that in p8 Show, its there !!!

enter image description here

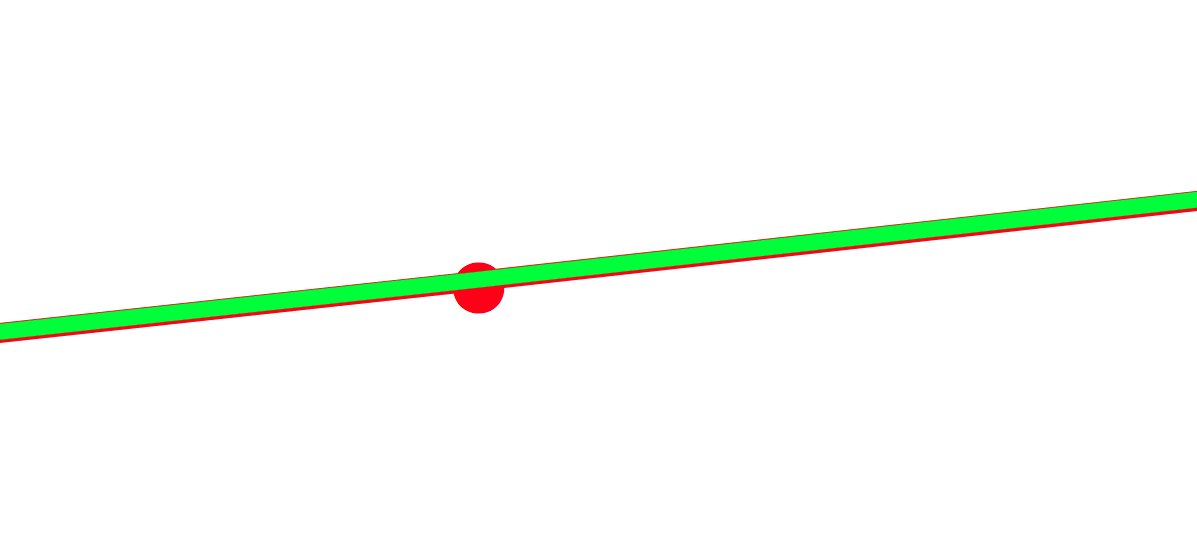
Now go ahead use little value of Magnify

Magnify[p8, 5]

enter image description here

Actually your Data and Curves are truly fitted on each other. Its means you are so pro Brother in what ever experiment is this !

First of all your p1 is not clear in graph despite i used Magnification.

So edit your p1 to be like this. you still can make Style no Thick

p1 = ListLogLogPlot[UvaluesAgainstYSteeltoYRubber, 
  AxesLabel -> {"E_Steel/e_Rubber", "U"}, PlotStyle -> {Thick, Red}, 
  PlotMarkers -> Automatic, 
     Joined -> True, PlotLegends -> {"compound model Ritz"}]

Now as you see that in p8 Show, its there !!!

enter image description here

Now go ahead use little value of Magnify

Magnify[p8, 5]

enter image description here

Actually your Data and Curves are truly fitted on each other. Its means you are so pro in what ever experiment is this !
Source Link
Alrubaie
  • 1.1k
  • 6
  • 14

First of all your p1 is not clear in graph despite i used Magnification.

So edit your p1 to be like this. you still can make Style no Thick

p1 = ListLogLogPlot[UvaluesAgainstYSteeltoYRubber, 
  AxesLabel -> {"E_Steel/e_Rubber", "U"}, PlotStyle -> {Thick, Red}, 
  PlotMarkers -> Automatic, 
     Joined -> True, PlotLegends -> {"compound model Ritz"}]

Now as you see that in p8 Show, its there !!!

enter image description here

Now go ahead use little value of Magnify

Magnify[p8, 5]

enter image description here

Actually your Data and Curves are truly fitted on each other. Its means you are so pro Brother in what ever experiment is this !