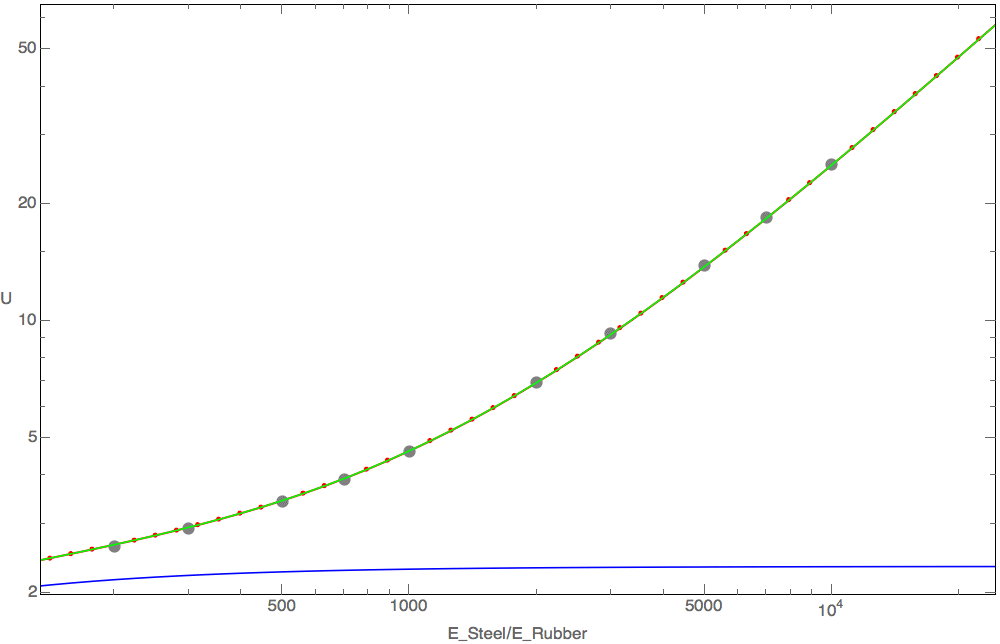
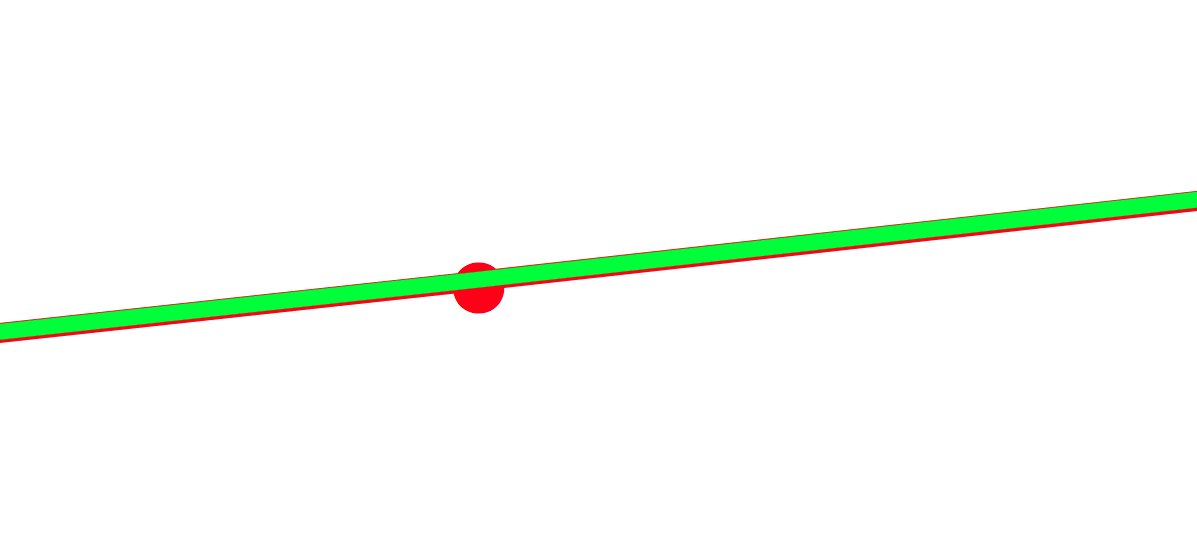
First of all your p1 is not clear in graph despite i used Magnification.
So edit your p1 to be like this. you still can make Style no Thick
p1 = ListLogLogPlot[UvaluesAgainstYSteeltoYRubber,
  AxesLabel -> {"E_Steel/e_Rubber", "U"}, PlotStyle -> {Thick, Red},
  PlotMarkers -> Automatic,
     Joined -> True, PlotLegends -> {"compound model Ritz"}]
Now as you see that in p8 Show, its there !!!
Now go ahead use little value of Magnify
Magnify[p8, 5]
Actually your Data and Curves are truly fitted on each other. Its means you are so pro Brother in what ever experiment is this !


