1
$\begingroup$

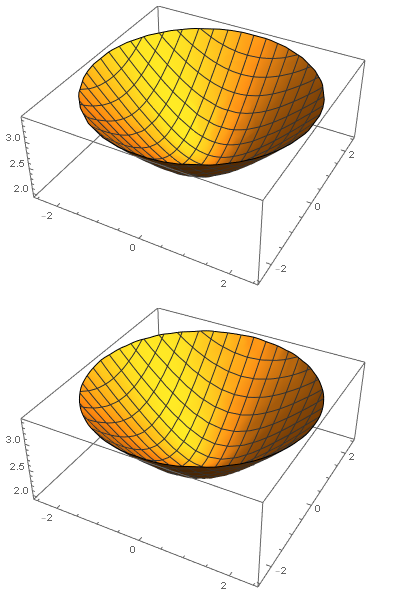
I am having trouble interpolating and plotting a set of 3D data. As it appears I have an unstructured grid, tried Interpolation[data, InterpolationOrder->1] but it returns all kinds of errors.

Interpolation::femimq: The element mesh has insufficient quality of -8.87646*10^-14. A quality estimate below 0. may be caused by a wrong ordering of element incidents or self-intersecting elements.
Interpolation::fememtlq: The quality -8.87646*10^-14 of the underlying mesh is too low. The quality needs to be larger than 0.`.

Also, when plotting with ListPlot3D, the default interpolation method fails.

I have uploaded the complete dataset here. Any help is welcome!

$\endgroup$

3 Answers 3

0
$\begingroup$

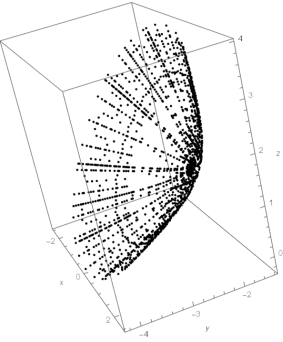
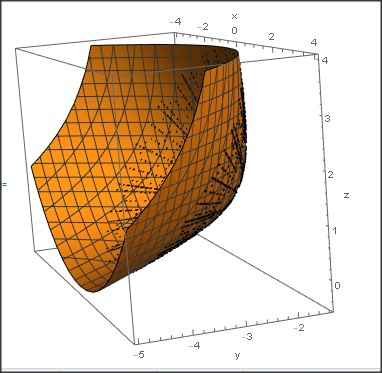
From the plot of your points, you can see that they are positioned on a surface of order 2, a so called Quadric. From the point plot you can also see, that z[x,y] is a multivalued function. You may now either turn the coordinate system, as Ulrich proposes, or, more general, find an implicit function representation of the surface.

Turning the coordinate system and them use Interpolation is easy and should be done for a quick result. The transformation is simply:

RotationMatrix[{{0, -1, 1}, {0, 0, 1}}].# & /@ data

But let us look at the second, more general and complex possibility. Assume that the data is contained in the list "data".

The general implicit equation for a surface of 2. order is fun[{x,y,z}]==0, where:

fun[vec_] = 1 + {c1, c2, c3}.vec + vec.{{c4, c5, c6}, {c5, c7, c8}, {c6, c8, c9}}.vec;

where ci are the parameters of the surface. We may fit this equation to our data points using least square. The error is:

err = Total[(fun /@ data)^2];
sol = NMinimize[err, {c1, c2, c3, c4, c5, c6, c7, c8, c9}][[2]]

this gives us the parameters ci and the implicit equation describing the quadric (a so called algebraic variety): quadric[{x,y,z}]==0, where:

quadric[{x_,y_,z_}]= fun[{x,y,z}]/.sol

We may plot this quadric by:

Show[{Graphics3D[{Point[d]}, Axes -> True, AxesLabel -> {"x", "y", "z"}],
  ContourPlot3D[quadric[{x,y,z}]==0, {x, -4, 4}, {y, -5, -.5}, {z, -1, 4}]
  }]
enter image description here

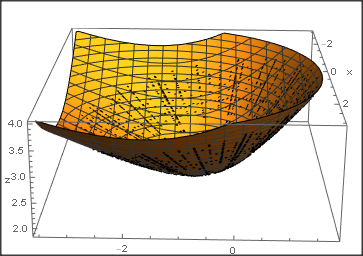
For further work it is best to work withe the implicit form quadric==0. However if an explicit form is needed, it is easier, as can be seen from the plot, to rotate the coordinate system so that the direction {0,1,1} is turned in the direction of the new z axis. By this z[x,y] becomes a single valued instead of a multivalued function:

quadricturned[{x_, y_, z_}] = quadric[RotationMatrix[{{0, 0, 1}, {0, -1, 1}}].{x, y,z}];

Show[{Graphics3D[{Point[ RotationMatrix[{{0, -1, 1}, {0, 0, 1}}].# & /@ data]}, Axes -> True,
    AxesLabel -> {"x", "y", "z"}], 
  ContourPlot3D[quadricturned[{x, y, z}] == 0, {x, -3, 3}, {y, -3.5, 2}, {z, 1.5, 4}]}]
enter image description here

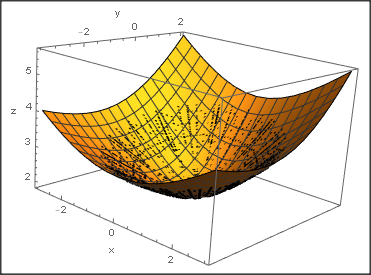
Now we can get the single valued z[{x,y}]. Because we have a quadratic equation, we still get 2 solutions. However, all our points are on one single solution and not on two as before. We therefore only need the second branch:

fz[{x_, y_}] = 
  z /. Solve[quadricturned[{x, y, z}] == 0, z][[2]] // Simplify;

Show[{Graphics3D[{Point[
     RotationMatrix[{{0, -1, 1}, {0, 0, 1}}].# & /@ data]}, 
   Axes -> True, AxesLabel -> {"x", "y", "z"}]
  , Plot3D[fz[{x, y}], {x, -3, 3}, {y, -3.5, 2}]}]
enter image description here

$\endgroup$
2
$\begingroup$

modified

You try an interpolation z[x,y] which isn't unique! That's why ListPlot3D partially fails for z~4&&y~-2:

Graphics3D[Point[data], Axes -> True, AxesLabel -> {x, y, z}]

enter image description here

A suitable coordinate transformation follows in one step with PrincipleComponent

dataT=PrincipalComponents[data]
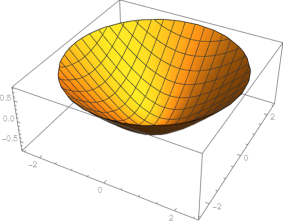
ListPlot3D[dataT]

enter image description here

Some points of the point cloud are to close to each other. DeleteDuplicates helps to get the interpolation function

ip =Interpolation[DeleteDuplicates[dataT,Norm[#1 - #2] < .01 &],InterpolationOrder -> 1]     

reg = ConvexHullRegion[dataT[[All, {1,2}]]];
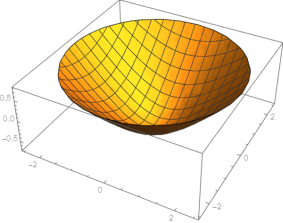
Plot3D[ip[x, y], Element[{x, y}, reg]]  

enter image description here

The transformation(rotationmatrix), if needed, follows with

FindGeometricTransform[data, dataT] 
$\endgroup$
2
  • $\begingroup$ Thank you for the reply. I can also plot the points using ListPointPlot3D. However, I also need to extract an interpolation function. Is that possible some way? $\endgroup$
    – amale
    Commented May 11, 2021 at 15:11
  • 1
    $\begingroup$ Think about how you want to describe the surface! z[x,y] here is unsuitable. Perhaps you might find a unique description in a rotated coordinatesystem! $\endgroup$ Commented May 11, 2021 at 15:19
1
$\begingroup$

In your case, a convex hull creates a flat capping surface with a nice defined normal. This normal defines a nice transformed coordinate system to create a one-to-one function, as has been mentioned in other answers.

Helper functions

(*Import required FEM package*)
Needs["NDSolve`FEM`"];
(*Element info shortcuts*)
ebi = ElementIncidents[#["BoundaryElements"]][[1]] &;
ebm = ElementMarkers[#["BoundaryElements"]][[1]] &;
ebn = #["BoundaryNormals"][[1]] &;
ei = ElementIncidents[#["MeshElements"]][[1]] &;
em = ElementMarkers[#["MeshElements"]][[1]] &;
epi = ElementIncidents[#["PointElements"]][[1]] &;
epm = Flatten@ElementMarkers[#["PointElements"]] &;
UF = Union@Flatten[#, Infinity] &;
(* Function to Extract Boundary Mesh by Marker ID *)
Clear[meshByBoundaryID]
meshByBoundaryID[m_][marker_] := Module[
  {inc = ebi[m], mrk = ebm[m], crd = m["Coordinates"], tinc, uniq, 
   newcrd, bm},
  tinc = Extract[inc, Position[mrk, marker]];
  uniq = UF@tinc;
  newcrd = crd[[UF@tinc]];
  tinc = tinc /. AssociationThread[uniq -> Range[Length@uniq]];
  bm = ToBoundaryMesh["Coordinates" -> newcrd, 
    "BoundaryElements" -> {TriangleElement[tinc, 
       ConstantArray[marker, Length@tinc]]}, "MeshOrder" -> 1];
  bm
  ]

Create and visualize boundary mesh

The following code imports the data and creates a convex hull mesh with ToElementMeshand then converted to a boundary mesh.

(*Import data*)
data = ToExpression /@ 
   StringSplit[
    Import["https://www.dropbox.com/s/2uloyr184cjfi9h/data.txt?dl=1", 
     "Text"], {"\n"}];
(*Create element mesh based on data points*)
mesh = ToElementMesh[data];
(*Extract boundary mesh*)
bmesh = ToBoundaryMesh[mesh];
(*Visualize boundary mesh*)
groups = bmesh["BoundaryElementMarkerUnion"];
temp = Most[Range[0, 1, 1/(Length[groups])]];
AssociationThread[groups, colors]
colors = ColorData["BrightBands"][#] & /@ temp;
bmesh["Wireframe"["MeshElementStyle" -> FaceForm /@ colors]]
(* Create instance of function based on grouped BoundaryMesh *)
bm = meshByBoundaryID[bmesh];

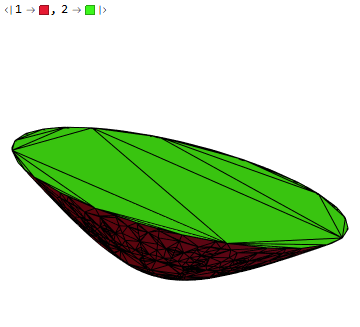
Boundary mesh

As the image shows, there are two surfaces separated by a feature angle. The green surface number 2 is what I call the capping surface.

Transforming coordinates

Now, we can transform the coordinates based on the unit normal of the capping surface.

bm1 = bm[1];(*Main mesh (Red)*)
bm2 = bm[2];(*Capping(Green)surface mesh*)
nz = -ebn[bm2] // Total // 
  Normalize;(*Get normal of capping surface mesh*)
(* Set up Transform Function*)
m = IdentityMatrix[4];
(* Rotation Part *)
m[[1 ;; 3, 1 ;; 3]] = Append[NullSpace[{nz}], nz];
tcrd = TransformationFunction[m][bm1["Coordinates"]];
mm = MinMax /@ Transpose@tcrd;
ListPlot3D[tcrd]
(*Create interpolation function*)
int = Interpolation[tcrd, InterpolationOrder -> 1];
Plot3D[int[x, y], {x, mm[[1, 1]], mm[[1, 2]]}, {y, mm[[2, 1]], 
  mm[[2, 2]]}, 
 RegionFunction -> 
  Function[{x, y, z}, x^2 + y^2 <= Max[Abs /@ mm[[1]]]^2]]

Transformed functions

This approach should work well for a well-behaved capping surface. You will be able to avoid potential difficulties fitting complex surfaces. If the capping surface is not well behaved, you are probably better off using Daniel's approach.

$\endgroup$
2
  • $\begingroup$ The complete coordinate transformation follows from PrincipalComponents[data]in one step! See my modified answer. $\endgroup$ Commented May 12, 2021 at 7:56
  • $\begingroup$ @UlrichNeumann That is a nice little trick! $\endgroup$
    – Tim Laska
    Commented May 13, 2021 at 3:54

Your Answer

By clicking “Post Your Answer”, you agree to our terms of service and acknowledge you have read our privacy policy.

Not the answer you're looking for? Browse other questions tagged or ask your own question.