1
$\begingroup$

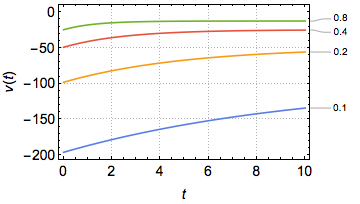
I need to plot the graph of :

$v(t) = \frac{-mg}{b} (e^{-\frac{b}{m}t}+1)$ , where $ g = 9.8 m/s^2$ and $b$ and $m$ are positive constants.

Is there a way to plot this without having to define random values for $b$ and $m$? I mean a way in which I can see how the graph behaves for different values of $b$ and $m$ ?

$\endgroup$
3
  • $\begingroup$ Unfortunately no, I am new to Mathematica, I only know the basics $\endgroup$
    – Physmath
    Commented Apr 22, 2021 at 2:17
  • $\begingroup$ I will take a look, thank you ! $\endgroup$
    – Physmath
    Commented Apr 22, 2021 at 2:22
  • 3
    $\begingroup$ To simplify little bit, you can introduce a new variable, say $\lambda=\frac{b}{m}$. Then you can Plot a sequence of curves for a list of $\lambda$ values. $\endgroup$
    – yarchik
    Commented Apr 22, 2021 at 3:03

1 Answer 1

4
$\begingroup$
v[s_, t_] := -g/s (Exp[-s t] + 1)
g = 9.8;
slist = {0.1, 0.2, 0.4, 0.8};
Plot[Evaluate[v[#, t] & /@ slist], {t, 0, 10}, 
 PlotTheme -> {"BoldColors", "Frame", "Grid"},
 FrameLabel -> {Automatic, v[t]},
 FrameStyle -> Directive[14, Black],
 PlotLabels -> slist
 ]

enter image description here

$\endgroup$
2
  • 1
    $\begingroup$ Plot[Evaluate[v[slist, t] , {t, 0, 10},...] works too. $\endgroup$ Commented Apr 22, 2021 at 8:02
  • $\begingroup$ @UlrichNeumann That is good suggestion, it makes the syntax more transparent. $\endgroup$
    – yarchik
    Commented Apr 22, 2021 at 8:12

Your Answer

By clicking “Post Your Answer”, you agree to our terms of service and acknowledge you have read our privacy policy.

Not the answer you're looking for? Browse other questions tagged or ask your own question.