To check if the Fourier coef. are correct, you can build the Fourier series and check if it gives the original function. For your first example:
Clear[fc, f];
fc[n_] = FourierCoefficient[Cos[t]^2, t, n]

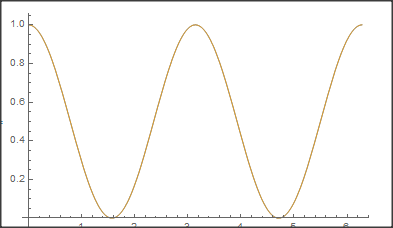
There a only a finite number of coefs. Further, as the original function is even, we only need Cos terms (the same coefs could have been obtained by FourierCosCoefficent). Therefore we obtain the series and plot it by:
f[t_] = Sum[fc[n] Cos[n t], {n, -2, 2}];
Plot[{f[t], Cos[t]^2}, {t, 0, 2 Pi}]

Both function are identical.
The second example is a bit more complicated. It has an infinite number of coefs and the period is different from 2 Pi. The description is not too clear, I assume a function is given that is 1 from -0.5..0.5 and otherwise 0 with a period of 3. To make things simple we first create a function with period 2Pi and scale it at the end. Toward this end we use not UnitBox[t] but UnitBox[t 1.5/Pi]. The coefs are:
Clear[fc, f1,f];
fc[s_] = FourierCoefficient[UnitBox[t 1.5/Pi], t, s]

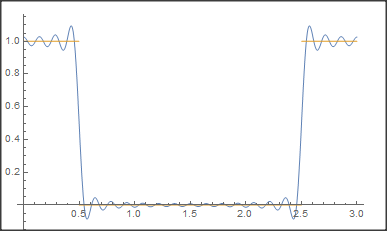
You see, there are an infinite number of coefs this time. The Fourier series is (we choose nmax=20 as an example. Play with it to see the effect):
nmax = 20;
f1[t_] = Sum[fc[n] Cos[n t], {n, -nmax, nmax}];
Now we have a function with period 2Pi. To scale it to 3 and plot the new function:
f[t_] = f1[t  Pi/1.5];
Plot[{f[t], UnitBox[Mod[t, 2.5]]}, {t, 0, 3}, PlotRange -> All]


Fourier[]already? $\endgroup$