Plot[x^2, {x, 0, 100},
 Ticks -> {{#, ScientificForm@#} & /@
    Range[0., 100., 30.], {#, ScientificForm@#} & /@
    Range[0., 100^2, 1000.]}, PlotRange -> All]

PowerTicks[label_][min_, max_] :=
  Block[{min10, max10}, min10 = Floor[Log10[min]];
   max10 = Ceiling[Log10[max]];
   Join[Table[{10^i,
      If[label, Superscript[10, i], Spacer[{0, 0}]]}, {i, min10,
      max10}],
    Flatten[
     Table[{k 10^i,
       Spacer[{0, 0}], {0.005, 0.`}, {Thickness[0.001`]}}, {i, min10,
       max10}, {k, 9}], 1]]];

ListLogLogPlot[Range[20]^3, Frame -> True,
 FrameTicks -> {{PowerTicks[True],
    PowerTicks[False]}, {PowerTicks[True], PowerTicks[False]}}]
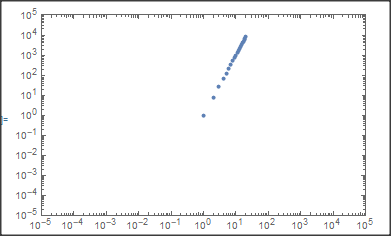
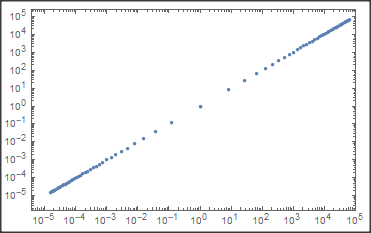
The above code works very well for the positive powers. Could some one please check it how does it change for the negative powers. More specific, on both axes the scales should be ranging {10^-5, 10^-4....10^0, 10^1, 10^2,...10^5}. Thanks!


