I've read this Rescale axes (e.g change from Hz to THz), and tried to change my horizontal of the graph but was failed. I want the $x$-axis is added by $1945$ "Without changing the graph".
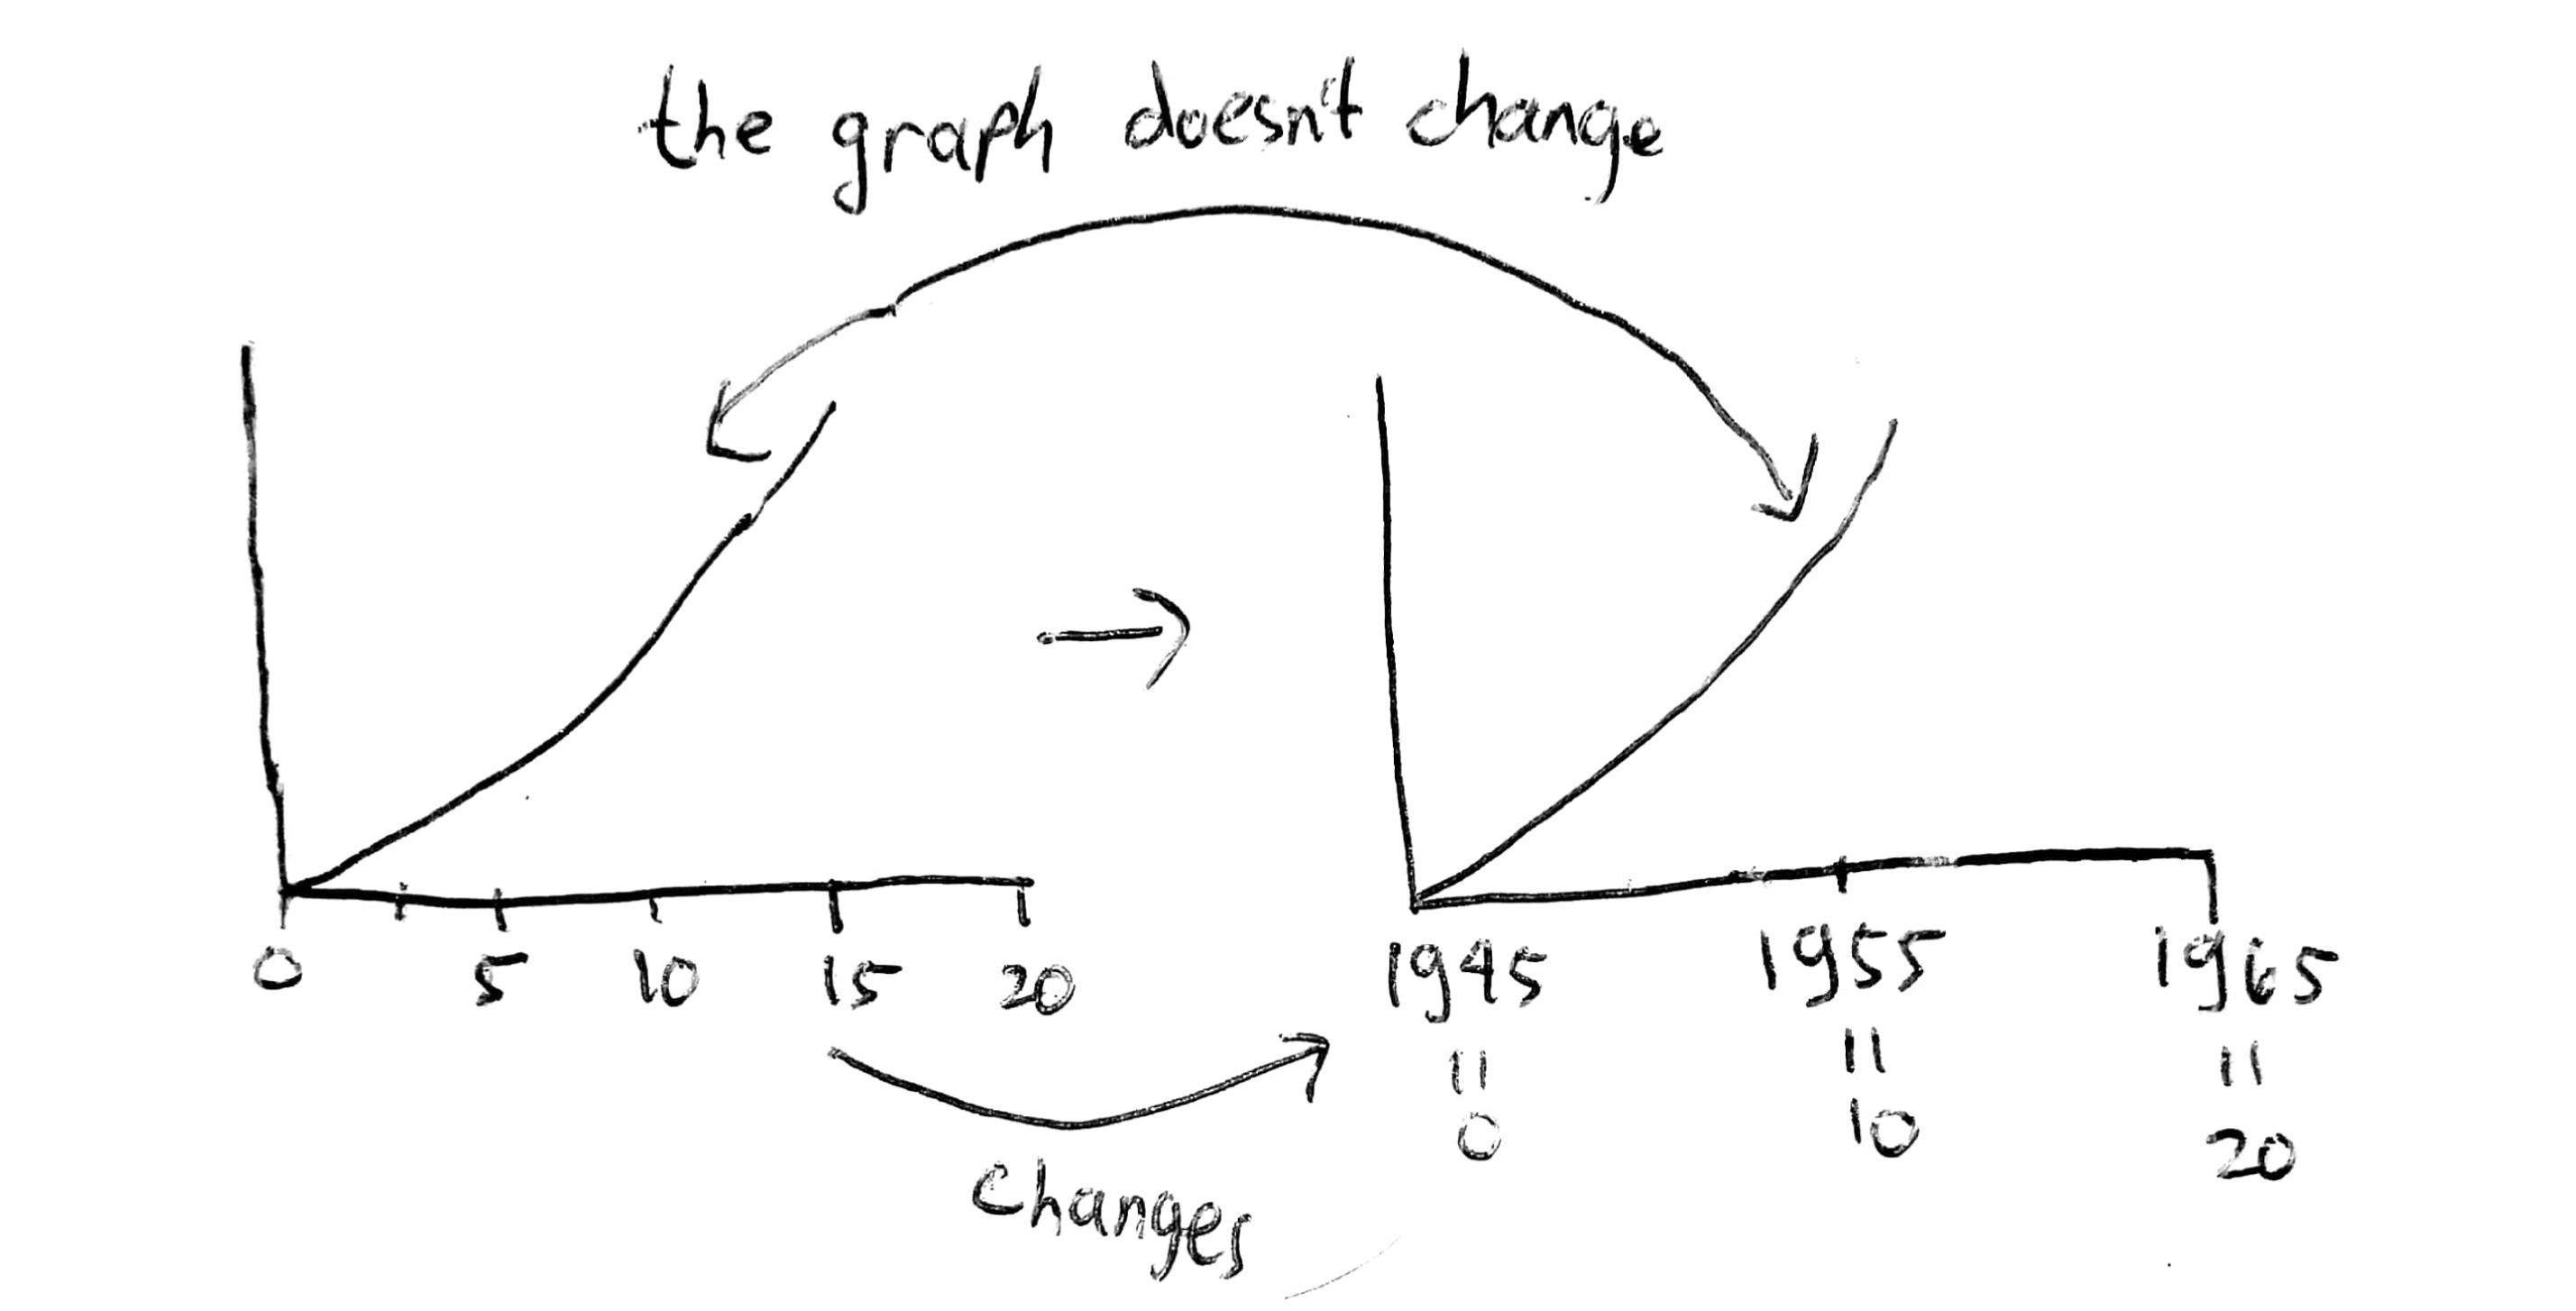
For example if my interval is $x\in[0,20]$, then my new interval should be $x\in[1945, 1965]$. And plotting the graph on that interval, i wish the new graph wouldn't change at all. So it's just the numbers that changed.
Here is the picture that might help you to understand my question (sorry for bad drawing).
The step size of the interval should be the same
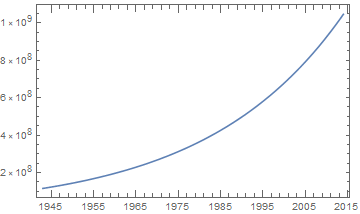
Here is my attempt:
pp := Plot[123456789 Exp[Log[163123123/123456789]/9 x], {x, -2, 69},
   Frame -> True];
fts = FrameTicks /. AbsoluteOptions[pp, FrameTicks];
fts[[1]] = ReplaceAll[#, {tick_, lbl_, {pos_}, {style_}} :> {tick,
       If[lbl == "", "", ToString[tick + (1945)]], {pos}, {style}}] &@
   fts[[1]];
pp
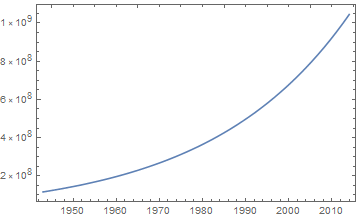
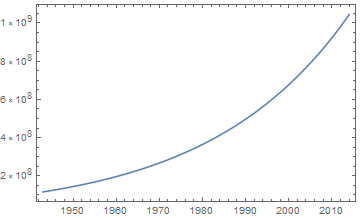
Plot[123456789 Exp[Log[163123123/123456789]/9 x], {x, -2, 69},
 Frame -> True, FrameTicks -> fts]


