3
$\begingroup$

I fetch financial data like this:

data = 
  FinancialData["SBUX", "Close", {{2013, 1, 1}, {2013, 8, 1}, "Week"}, "Value"];

The above expression will return timeseries formatted data. How would I convert this to a regular list with even spacing (this is very important to me) to make interpolation on this data set work?

$\endgroup$

3 Answers 3

4
$\begingroup$

The time series that FinancialData creates has the option TemporalRegularity -> Automatic. With this option, this series does not interpolate values.

data = 
  FinancialData["SBUX", "Close", {{2013, 1, 1}, {2013, 8, 1}, "Week"}, "Value"];

Time series that aren't regularly sampled can interpolate values with the option TemporalRegularity -> True. To demonstrate, let's use TimeSeries to make a list of dates between two of the data samples. Change the data time series to assume regular time samples with TemporalRegularity -> True.

 {dt1, dt2} = data["Dates"][[9;;10]];
 dates = DateRange[dt1, dt2];
 ts = TimeSeries[data, TemporalRegularity -> True];

The data series does not interpolate values.

data[dates]

{$27.43, $27.43, $27.43, $27.43, $27.43, $27.43, $27.43, $29.33}

With TemporalRegularity -> True, the ts series linearly interpolates values for dates between samples.

ts[dates]

{$27.43, $27.71, $27.98, $28.25, $28.52, $28.79, $29.06, $29.33}


To get evenly-spaced interpolated values for the entire time series, use the first and last dates of the series for the list of dates. With these new dates, ts[dates] gives regular, evenly-spaced values. Here's a plot of the interpolated values.

ts = TimeSeries[data, TemporalRegularity -> True];
{dt1, dt2} = ts /@ {"FirstDate", "LastDate"};
dates = DateRange[dt1, dt2];
DateListPlot[Transpose[{dates, ts[dates]}]]
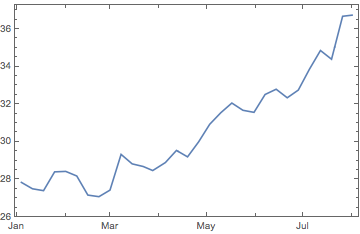
interpolated values from time series

$\endgroup$
7
  • $\begingroup$ Thank you. BTW very elegant response. Do you know how to take the dollar values and convert it into a pure numerical list? e.g. {27.43, 27,71, ...}. $\endgroup$
    – Jon Du
    Commented Jan 17, 2021 at 14:28
  • $\begingroup$ @JonDu I'm happy the answer was helpful... and yes, remove the dollar units from values with QuantityMagnitude. $\endgroup$
    – creidhne
    Commented Jan 17, 2021 at 15:22
  • $\begingroup$ can I ask what [[9 ;; 10]] means in your code? I understand [[]] is to extract the value but what does [[a;;b]] mean? $\endgroup$
    – Jon Du
    Commented Jan 18, 2021 at 12:43
  • $\begingroup$ @JonDu [[a ;; b]] gives parts a through b of an expression, for example, {2, 4, 6, 8, 10}[[2 ;; 4]] gives {4, 6, 8}. See the documentation for Part. I picked the [[9 ;; 10]] samples because they show a clear example of the interpolation. $\endgroup$
    – creidhne
    Commented Jan 18, 2021 at 13:11
  • $\begingroup$ Cool! I have another issue that when I try to see output of data[dates] it always shows 8 elements even though I set the dates interval to 3 months. So when I do QuantityMagnitude[data[dates]] there are 8 values. Is there a way to take out all the price data from the interval I defined? $\endgroup$
    – Jon Du
    Commented Jan 19, 2021 at 16:30
1
$\begingroup$

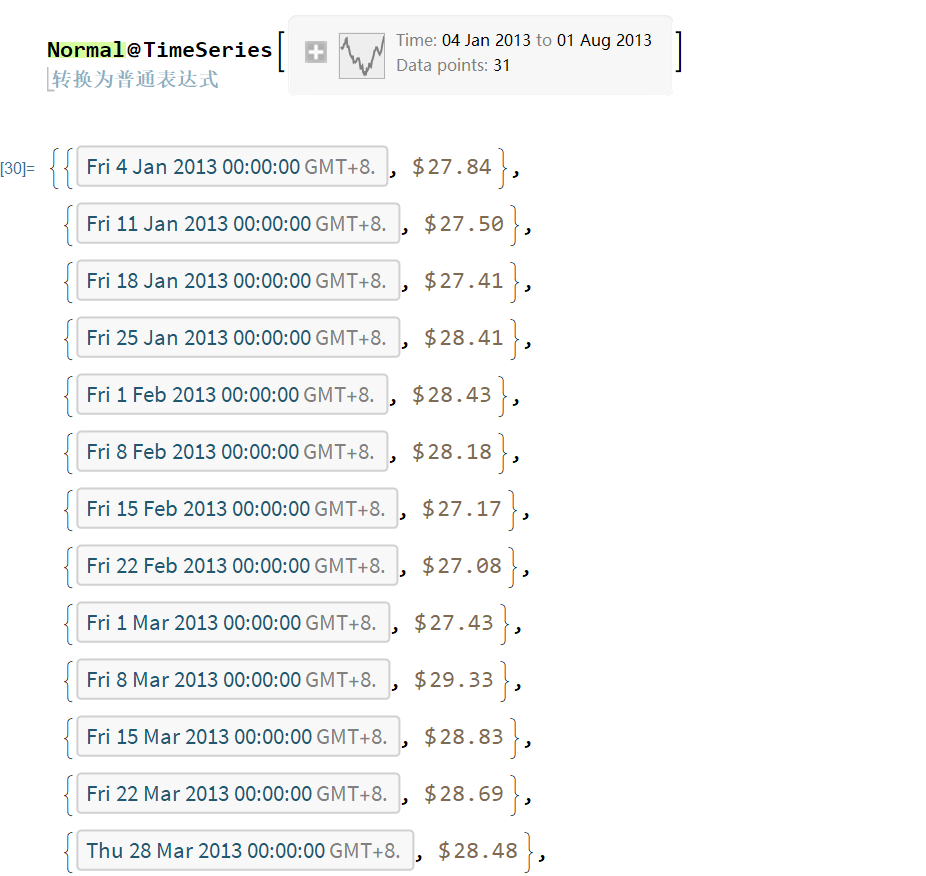
Ummm, I'm not sure what do you want. Likely, just use Normal:

enter image description here

$\endgroup$
1
  • $\begingroup$ I think you misunderstood my question, but Normal is a cool function $\endgroup$
    – Jon Du
    Commented Jan 18, 2021 at 12:46
1
$\begingroup$
data = FinancialData["SBUX", "Close", {{2013, 1, 1}, {2013, 8, 1}, "Week"}, "Value"]

enter image description here

data["Properties"]
{"DatePath", "Dates", "FinancialProperty", "FirstDate", "FirstTime",
 "FirstValue", "LastDate", "LastTime", "LastValue", "Path", 
 "PathComponent", "PathComponents", "PathFunction", "PathLength", 
 "Times", "ValueDimensions", "Values"} 

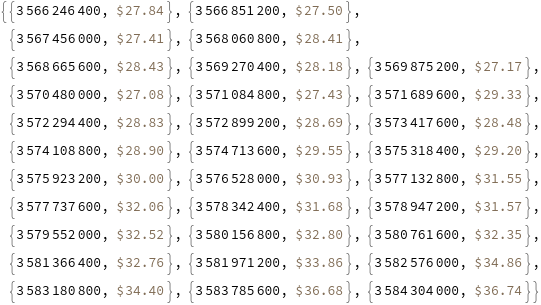
You can use the property "Path":

data["Path"]

enter image description here

$\endgroup$

Your Answer

By clicking “Post Your Answer”, you agree to our terms of service and acknowledge you have read our privacy policy.

Not the answer you're looking for? Browse other questions tagged or ask your own question.