5
$\begingroup$

I have a set of data with a list of dates (all Sundays in this case) and associated amounts. Most of these are every week, but some correspond to multiple weeks added together. I would like to average over those items that contain multiple weeks, to have just single weeks.

data = {{"18/03/2018", 323.4}, {"25/03/2018", 339.55}, {"01/04/2018", 201.45}, {"15/04/2018", 733.17}, {"29/04/2018", 691.44}, {"06/05/2018", 383.16}, {"13/05/2018", 386.2}, {"20/05/2018", 218.33}, {"27/05/2018", 382.7}, {"10/06/2018", 735.43}, {"17/06/2018", 232.15}, {"24/06/2018", 430.2}, {"01/07/2018", 298.5}, {"08/07/2018", 338.5}, {"15/07/2018", 264.05}, {"29/07/2018", 625.44}, {"05/08/2018", 353.01}, {"26/08/2018", 274.19}, {"02/09/2018", 368.25}}

data2 = {DateObject[{#[[1]], {"Day", "Month", "Year"}}], #[[2]]} & /@ data

You can see how multiple weeks are combined, resulting in a higher data point:

DateListPlot[data2, Joined -> False]

enter image description here

I know I could do this manually by working out the difference between each pair of data points, but as I'm so unfamiliar with how to use date/time objects I suspect there is a better way. My goal is to work on the weekly averages (to predict the overall trend).

Answers that don't require the data to be regular days each week (i.e. not always a multiple of 7 days between them) would be nice to see too.

$\endgroup$
3
  • 2
    $\begingroup$ tried TimeSeriesAggregate? $\endgroup$
    – kglr
    Commented Mar 1, 2019 at 22:57
  • $\begingroup$ @kglr, i couldn't see any obvious way to do it with that. $\endgroup$
    – SPPearce
    Commented Mar 2, 2019 at 16:11
  • $\begingroup$ KraZug, i thought your data contained multiple observations for some weeks. With your data (some observations are aggregates of several weeks ) you need an initial processing to resample. I wil post an answer if i can come up with a clean way to combine the two steps. $\endgroup$
    – kglr
    Commented Mar 2, 2019 at 16:52

2 Answers 2

4
$\begingroup$

It is possible that this could be solved with TimeSeriesAggregate as kglr has pointed out, but here is a different solution:

{dates, values} = Transpose@data2;

nWeeks = Floor@Prepend[1]@BlockMap[
     QuantityMagnitude@DateDifference[#[[1]], #[[2]], "Week"] &,
     dates, 2, 1
     ];

pos = Floor /@ Accumulate[nWeeks];
nWeeks = Normal@SparseArray[pos -> nWeeks];
values = Normal@SparseArray[pos -> values];

forwardFill[list_] := FoldList[If[#2 == 0, #, #2] &, list]
backFill[list_] := Reverse@forwardFill[Reverse@list]

dates = Append[Last[dates]]@DateRange[First[dates], Last[dates], "Week"];
values = backFill[values]/backFill[nWeeks];

DateListPlot[Transpose@{dates, values}, Joined -> False]

Mathematica graphics

$\endgroup$
2
  • $\begingroup$ This gives me one more element in dates than values, and hence the Transpose fails. $\endgroup$
    – SPPearce
    Commented Mar 3, 2019 at 7:34
  • $\begingroup$ @KraZug I just tried it again and it works. Try to restart your kernel and see if that helps. If that doesn't help, please tell me what version of Mathematica you're on. I'm on 11.3. $\endgroup$
    – C. E.
    Commented Mar 3, 2019 at 8:02
3
$\begingroup$

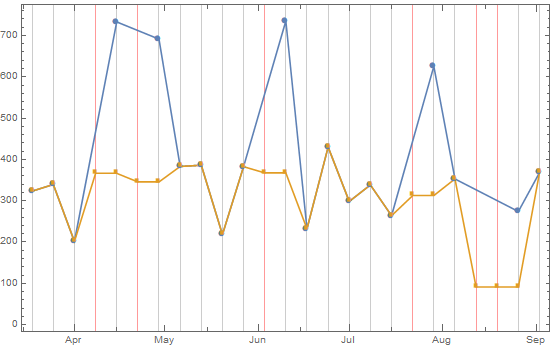
You can use TimeSeriesResample to insert 0s at skipped weeks, Split to re-group the data, and take averages in each group:

data2B = Join @@ (Thread[{#, Mean@#2} & @@ Transpose[#]] & /@ 
  Split[TimeSeriesResample[data2, "Week", ResamplingMethod->{"Constant", 0}], #[[2]]==0 &]);

mesh = DateRange[#, DatePlus[#2, {1, "Week"}], "Week"] & @@ DateBounds[data2[[All, 1]]];
gridlines = Join[data2[[All, 1]], Thread[{Complement[mesh, data2[[All, 1]]], Red}]];

DateListPlot[{data2, data2B}, GridLines -> {gridlines, None}, PlotMarkers -> Automatic]

enter image description here

Update: Alternatively, you can use ResamplingMethod -> None and use SequenceReplace to replace sequences of Missing[] followed by a value with the value divided by the length of the sequence:

data2C = Transpose[MapAt[SequenceReplace[
     s : {__Missing, c_} :> Sequence @@ ConstantArray[c/Length[s], Length[s]]], 
    Transpose[Prepend[Rest[TimeSeriesResample[data2, "Week", ResamplingMethod -> None]], 
      First[data2]]], {2}]];
data2C == data2B

True

$\endgroup$

Your Answer

By clicking “Post Your Answer”, you agree to our terms of service and acknowledge you have read our privacy policy.

Not the answer you're looking for? Browse other questions tagged or ask your own question.