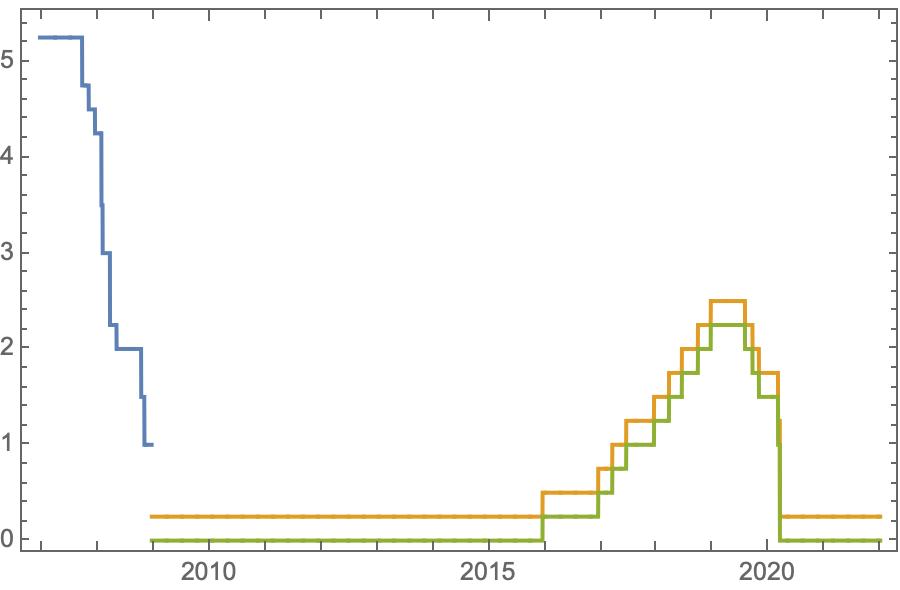
I download three time series from FRED:
fred = ServiceConnect["FederalReserveEconomicData"]
ffr10 = fred["SeriesData","ID"->{"DFEDTAR"},"Date"  ->{"2006-12-16","2022-01-01"}];
ffr11 = fred["SeriesData","ID"->{"DFEDTARU"},"Date" ->{"2006-12-16","2022-01-01"}];
ffr12 = fred["SeriesData","ID"->{"DFEDTARL"},"Date" ->{"2006-12-16","2022-01-01"}];
and I plot them:
DateListPlot[{ffr10, ffr11, ffr12}]
I would like to add a time point to the blue series (ffr10): {First date of orange series (ffr12), first value of orange series (ffr12)}, so that the lines connect. How can I do it?


TimeSeriesInsert[ffr10, First@ffr12["Path"]]orTimeSeriesInsert[ffr10, ffr12]? $\endgroup$