9
$\begingroup$

I'm using Mathematica 12.1.1.0.

When I enter

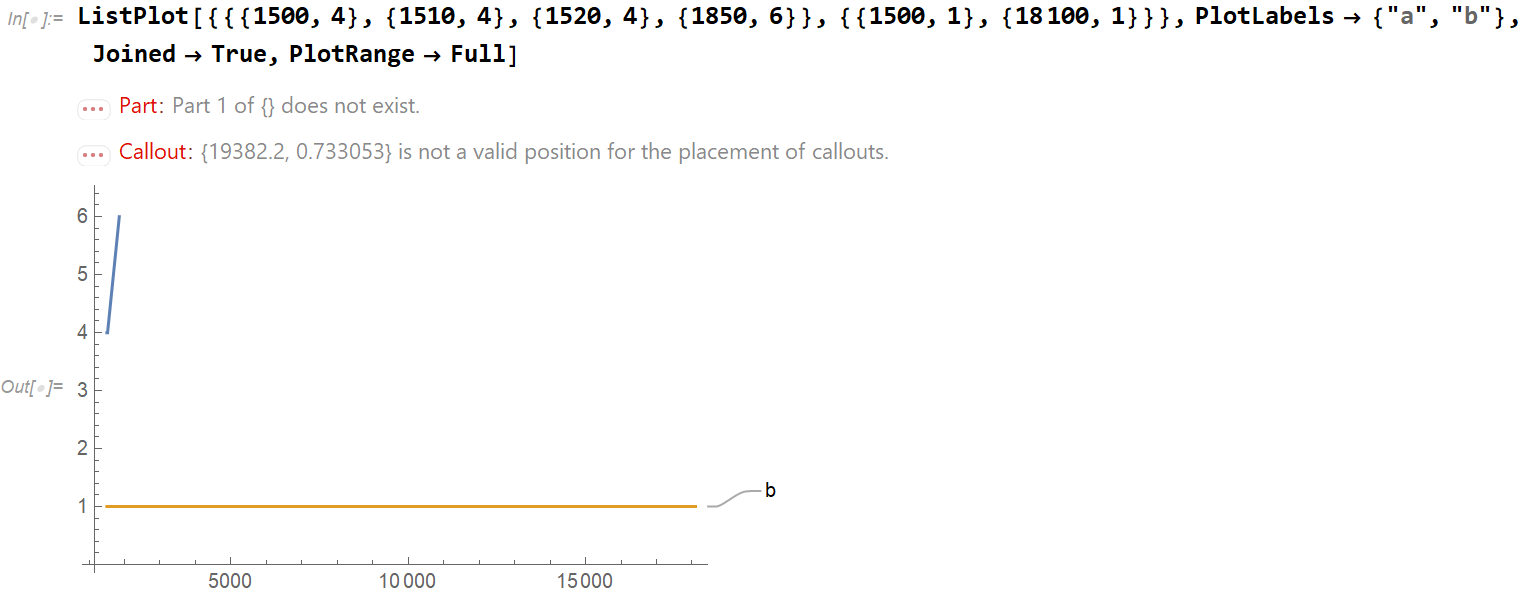
ListPlot[{{{1500, 4}, {1510, 4}, {1520, 4}, {1850, 6}}, {{1500, 
    1}, {18100, 1}}}, PlotLabels -> {"a", "b"}, Joined -> True, 
 PlotRange -> Full]

I get

Part::partw: Part 1 of {} does not exist.
Callout::copos: {19382.2,0.733053} is not a valid position for the placement of callouts.

enter image description here

What's going on here? How do I avoid getting these error messages?

Edit: I've also emailed Wolfram Support about this, with ID [CASE:4760915]. I'll post any updates they give. I'm still interested in a workaround.

$\endgroup$
2
  • 2
    $\begingroup$ Can't reproduce in 12.2.0, win 10, looks like a (already fixed) bug. $\endgroup$
    – xzczd
    Commented Jan 7, 2021 at 3:29
  • $\begingroup$ It seems to be fixed in 12.2.0 on macOS as well, though I do get the error on 12.1.1 macOS as well. Hopefully someone will be able to offer a workaround. $\endgroup$
    – MassDefect
    Commented Jan 7, 2021 at 3:50

2 Answers 2

4
$\begingroup$

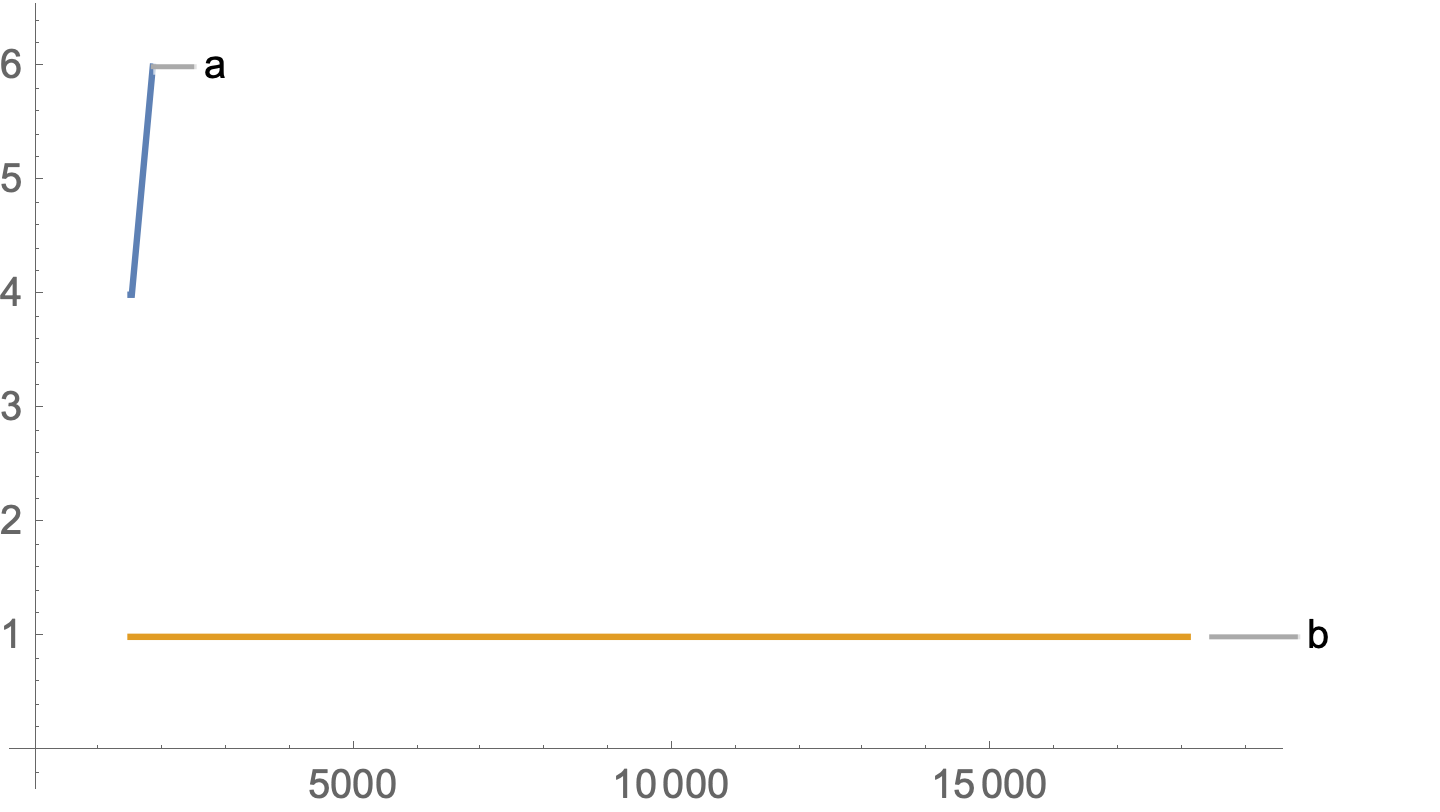
As a workaround

$Version

"12.1.1 for Mac OS X x86 (64-bit) (June 19, 2020)"

data = {{{1500, 4}, {1510, 4}, {1520, 4}, {1850, 6}}, {{1500, 1}, {18100, 1}}};

labels = {"a", "b"};

Show[
 ListPlot[#[[1]],
    PlotStyle -> ColorData[97][#[[2]]],
    PlotLabels -> #[[3]],
    Joined -> True] & /@
  Transpose[{data, Range[Length[data]], labels}],
 PlotRange -> All,
 AxesOrigin -> {0, 0}]

enter image description here

Alternatively,

Show[
 ListPlot[#1, 
    PlotStyle -> ColorData[97][#2], 
    PlotLabels -> #3, 
    Joined -> True] & @@@ 
  Transpose[{data, Range[Length[data]], labels}], 
 PlotRange -> All, 
 AxesOrigin -> {0, 0}]
$\endgroup$
5
$\begingroup$

I am using V12.1.1.0 on MacOS 10.13.4 and I can reproduces your problem. I found the following work-around:

ListPlot[
  {Callout[
     {{1500, 4}, {1510, 4}, {1520, 4}, {1850, 6}}, 
       "a", {{2500, 6}, {0, .5}}, {2100, 6}],
   Callout[{{1500, 1}, {18100, 1}}, "b"]},
   Joined -> True, PlotRange -> All]

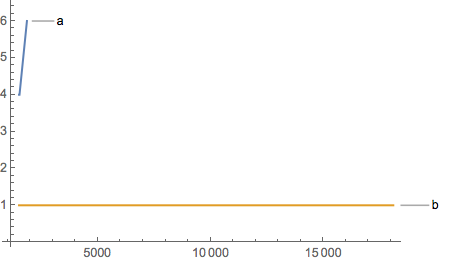
plot

The work-around requires giving up the easy-to-use PlotLabels option and placing a callout wrapper around the 1st dataset, so the excellent micromanaging capabilities provided by Callout can be used.

$\endgroup$

Your Answer

By clicking “Post Your Answer”, you agree to our terms of service and acknowledge you have read our privacy policy.

Not the answer you're looking for? Browse other questions tagged or ask your own question.