2
$\begingroup$

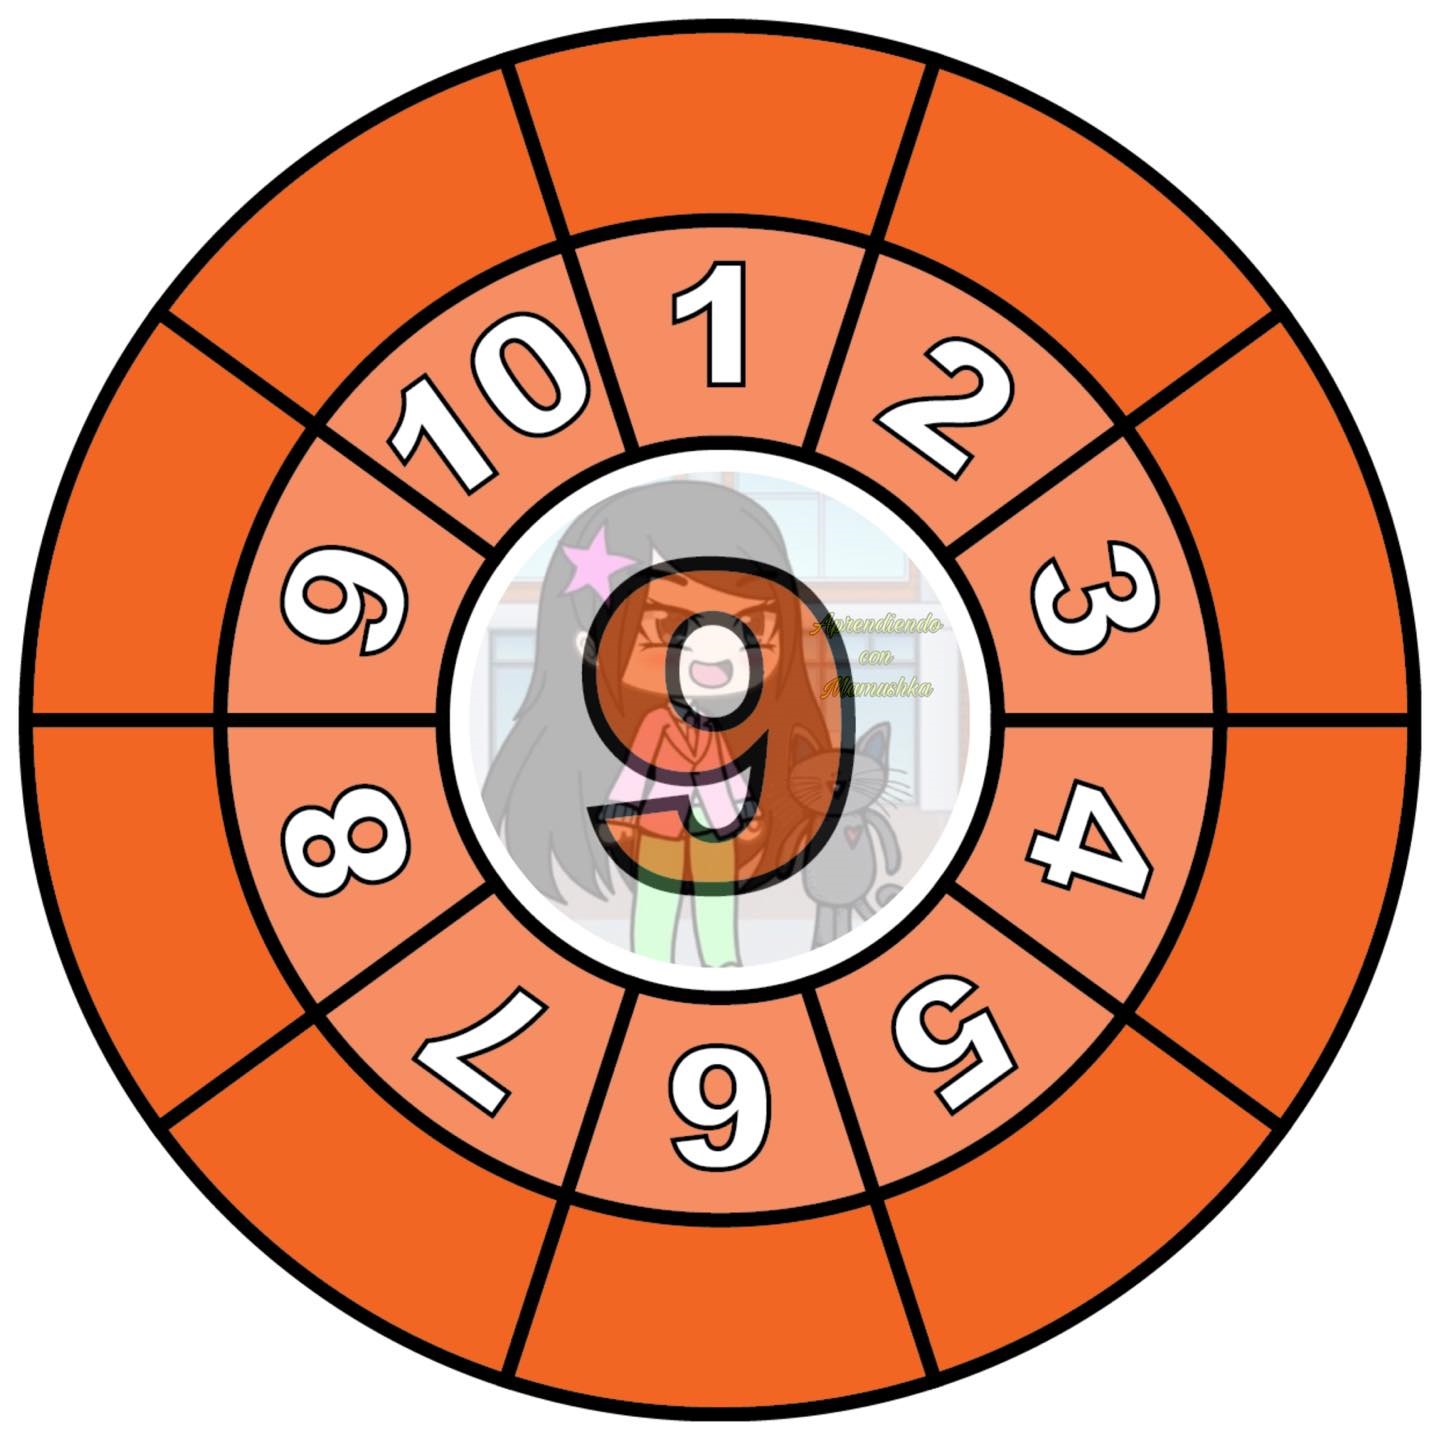
Hello there if you can give me a hand I want to create and export to pdf the following figure, which if you realize forms the multiplication table. The idea is to be able to control the central number (nc), the final number (nf), and the amount of divisions (nd) and that on the outside I give as output the results. For example if I write nc=1, and nf=15, nd =20 , it will create 15 equal concentric circles with the tables from 1x1 to 15x15 and export them to pdf , where each concentric circle built will have about 10 or 12 cm (I am not sure if what I see on screen is the same as what I see later in the pdf) My code created the very small central circle, I don't know if it can be improved. Thanks for any help. Circle
nc = Input["central number"];

nf = Input["final number"];

nd = Input["number of divisions"];
drawCircle[x_, y_, r_ /; r > 10] := {Circle[{x, y}, r], 

drawCircle[x, y, r/2]};

drawCircle[__] := {} drawCircle[0, 0, 60] // Graphicsenter

$\endgroup$
2
  • $\begingroup$ tried PieChart? E.g., nd = 10; centernumber = 9; PieChart[{{Labeled[1, Style[centernumber, 48, White], {{0, 0}, {.5, .5}}]}, Labeled[1, Style[#, 24]] & /@ Range[nd], ConstantArray[1, nd]}, ChartStyle -> { "Rainbow", None}, SectorOrigin -> {{Pi/2, -1}, 0}] $\endgroup$
    – kglr
    Commented Oct 12, 2020 at 0:58
  • $\begingroup$ @kglr, thank you very much ,works quite well, you could add a line that puts in the red part the result of the central number multiplied by the one in the middle $\endgroup$
    – Susana
    Commented Oct 12, 2020 at 1:59

1 Answer 1

0
$\begingroup$
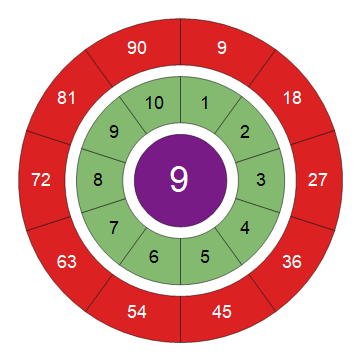
nd = 10;
centernumber = 9;
PieChart[{{Labeled[1, Style[centernumber, FontSize -> Scaled[.1], White], 
    {{0, 0}, {.5, .5}}]}, 
  Labeled[1, Style[#, FontSize -> Scaled[.05]]] & /@ Range[nd], 
  Labeled[1, Style[#, FontSize -> Scaled[.05], White]] & /@ (centernumber Range[nd])}, 
 ChartStyle -> { "Rainbow", None}, 
 SectorOrigin -> {{Pi/2, -1}, 0}]

enter image description here

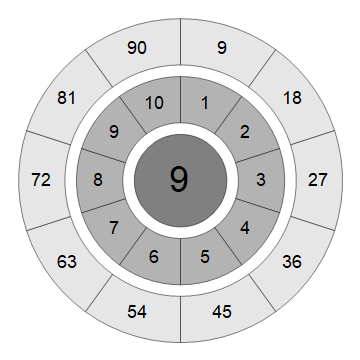
PieChart[{{Labeled[1, Style[centernumber, FontSize -> Scaled[.1]], {{0, 0}, {.5, .5}}]}, 
  Labeled[1, Style[#, FontSize -> Scaled[.05]]] & /@ Range[nd], 
  Labeled[1, Style[#, FontSize -> Scaled[.05]]] & /@  (centernumber Range[nd])}, 
 SectorOrigin -> {{Pi/2, -1}, 0}, 
 ChartStyle -> {GrayLevel /@ {.5, .7, .9}, None}]

enter image description here

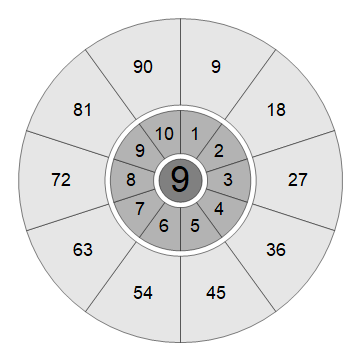
To have different radii for the three layers use SectorChart:

r1 = 1; r2 = 2; r3 = 4;

SectorChart[{{Labeled[{1, r1}, Style[centernumber, FontSize -> Scaled[.1]], 
     {{0, 0}, {.5, .5}}]},
   Labeled[{1, r2}, Style[#, FontSize -> Scaled[.05]]] & /@ Range[nd],
   Labeled[{1, r3}, Style[#, FontSize -> Scaled[.05]]] & /@ 
    (centernumber Range[nd])}, 
  SectorOrigin -> {{Pi/2, -1}, 0}, 
  ChartStyle -> {GrayLevel /@ {.5, .7, .9}, None}]

enter image description here

$\endgroup$
5
  • $\begingroup$ ,It works great, thanks, would be so kind to explain the code, I can not see the code that multiplies. My knowledge is limited, another thing that variables control the colors of the circles, for example if I wanted to leave it with black numbers and the rest all white but to see the circles in black, think that I will print them most probably in black and white. $\endgroup$
    – Susana
    Commented Oct 12, 2020 at 2:26
  • $\begingroup$ @Susana, I updated to make the line where multiplication is done more clear. $\endgroup$
    – kglr
    Commented Oct 12, 2020 at 2:37
  • $\begingroup$ @kglr_I understood the modification you made thanks, only two more things I can't understand how to do it a) how do you control the size of the circles b) how do you export the result to a pdf to print it $\endgroup$
    – Susana
    Commented Oct 12, 2020 at 3:15
  • $\begingroup$ @Susana, for (a) play with different values for the option ImageSize to change the overall size of the graphics. for (b) see the docs pages "PDF" and the tutorial ExportingGraphicsAndSounds $\endgroup$
    – kglr
    Commented Oct 12, 2020 at 3:34
  • $\begingroup$ @kglr_thank you very much with your indications is ok $\endgroup$
    – Susana
    Commented Oct 12, 2020 at 16:06

Your Answer

By clicking “Post Your Answer”, you agree to our terms of service and acknowledge you have read our privacy policy.

Not the answer you're looking for? Browse other questions tagged or ask your own question.