nd = 40;
SeedRandom[1]
dts = RandomVariate[NormalDistribution[40 + #, 10],
     RandomInteger[{500, 1000}]] & /@ Range[nd];

Length /@ dts
{918, 570, 594, 772, 823, 805, 685, 953, 967, 900, 804, 625, 616,
874, 660, 793, 960, 899, 771, 1000, 800, 567, 950, 507, 789, 631,
504, 588, 628, 788, 862, 561, 759, 560, 837, 898, 506, 978, 693, 971}
idts = MapIndexed[Thread[{#, 50 (#2[[1]])}] &, dts];
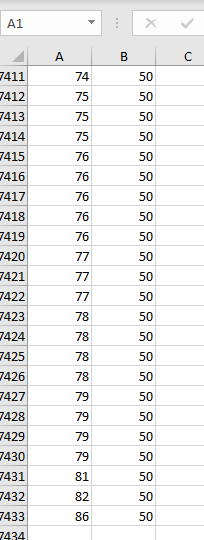
First 5 rows of the first data set:
idts[[1, ;; 5]] // Grid[#, Dividers -> All] &

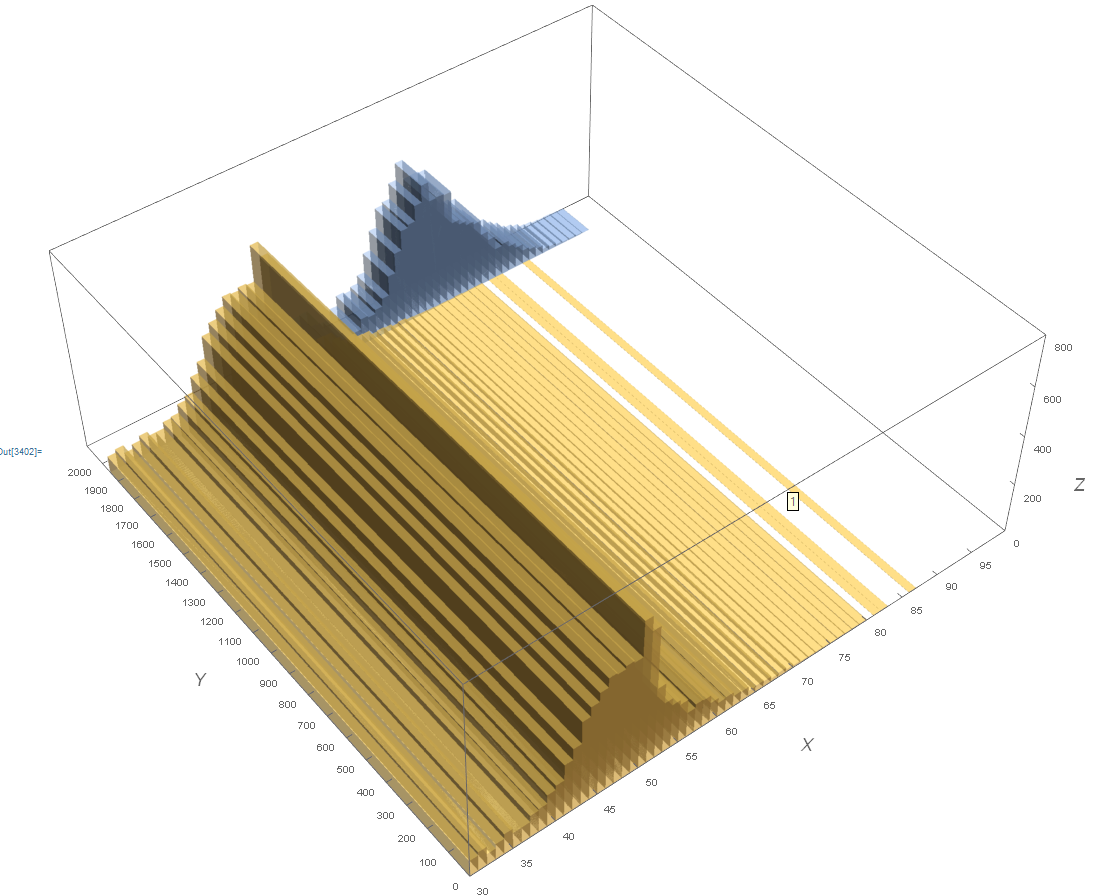
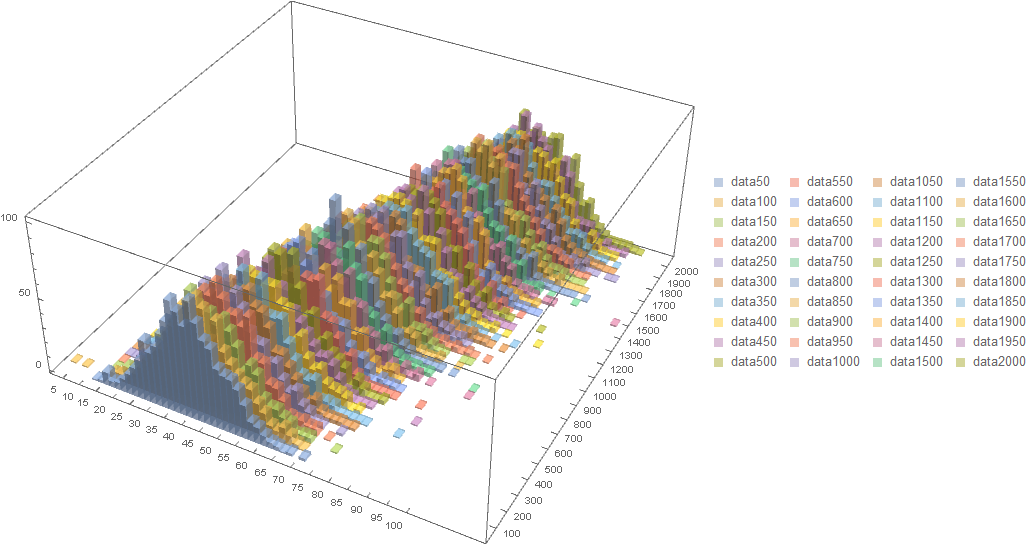
Histogram3D[idts, {{"Raw", 66}, {"Raw", nd}}, "Count",
 ImageSize -> 700,
 ChartLegends -> {"data" <> ToString[50 #] & /@ Range[nd]},
 Ticks -> {Range[0, 100, 5], Range[0, 2000, 100], Automatic}]
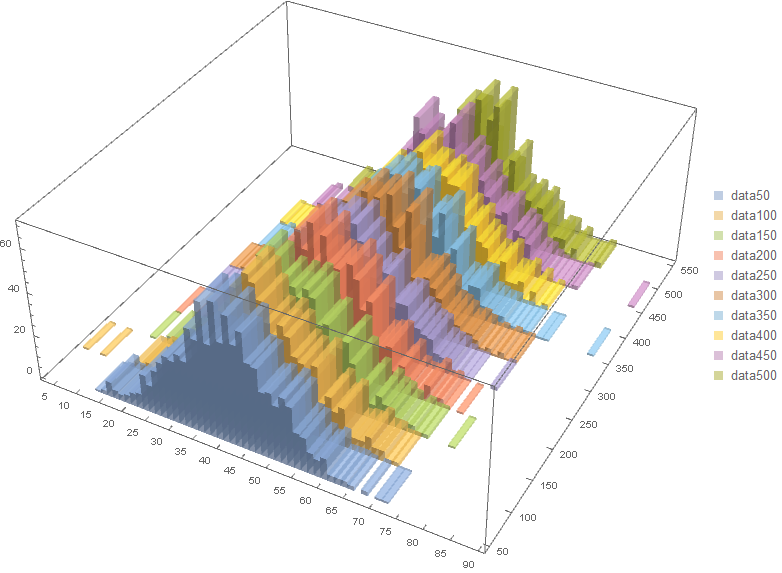
To see the first 10 data sets in more detail:
Histogram3D[idts[[;; 10]], {{"Raw", 66}, {"Raw", 10}}, "Count",
 ImageSize -> 700,
 ChartLegends -> {"data" <> ToString[50 #] & /@ Range[10]},
 Ticks -> {Range[0, 100, 5], Range[0, 2000, 50], Automatic}]
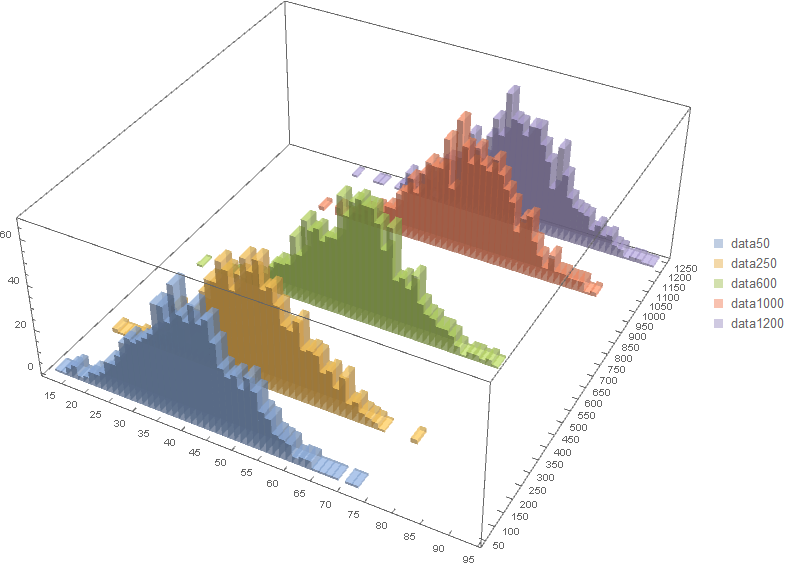
To chart non-contiguous subsets of the 40 data sets, we need to change the bin specification for the y direction to {50} ( or to {50,2000,50}):
Histogram3D[idts[[{1, 5, 12, 20, 24}]], {{"Raw", 66}, {50}}, "Count",
 ImageSize -> 700,
 ChartLegends -> {"data" <> ToString[50 #] & /@ {1, 5, 12, 20, 24}},
 Ticks -> {Range[0, 100, 5], Range[0, 2000, 50], Automatic}]
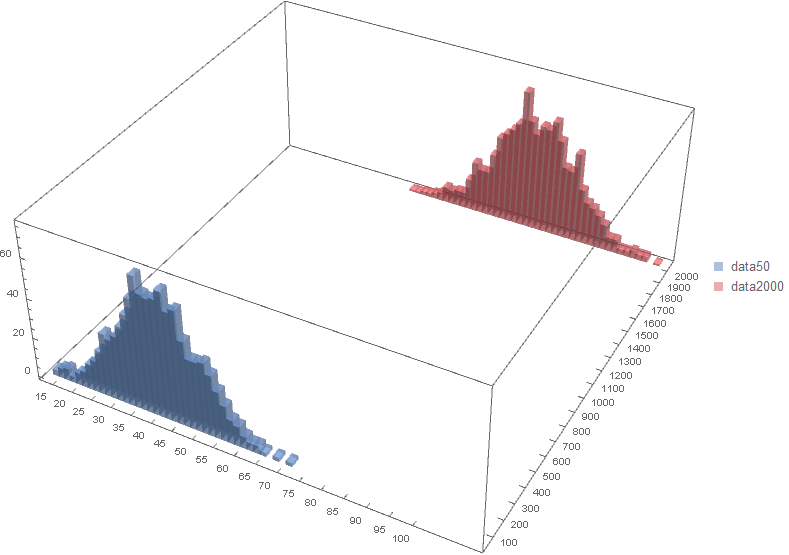
To show only two of 40 datasets we need a trick (to work around a possible bug): add a third data set and set its style to None:
Histogram3D[idts[[{1, 40, 40}]], {{"Raw", 66}, {50}}, "Count",
 ImageSize -> 700,
 ChartStyle -> {{ ColorData[97] @ 1, ColorData[97] @ 40, None}},
 ChartLegends -> ("data" <> ToString[50 #] & /@ {1, 40}),
 Ticks -> {Range[0, 100, 5], Range[0, 2000, 100], Automatic}]
The specification {"Raw", 66} gives 66 bins in x direction for the combined data set:
Length[HistogramList[Join @@ idts, {{"Raw", 66}, {"Raw", nd}}, "Count"][[1, 1]]] - 1
66
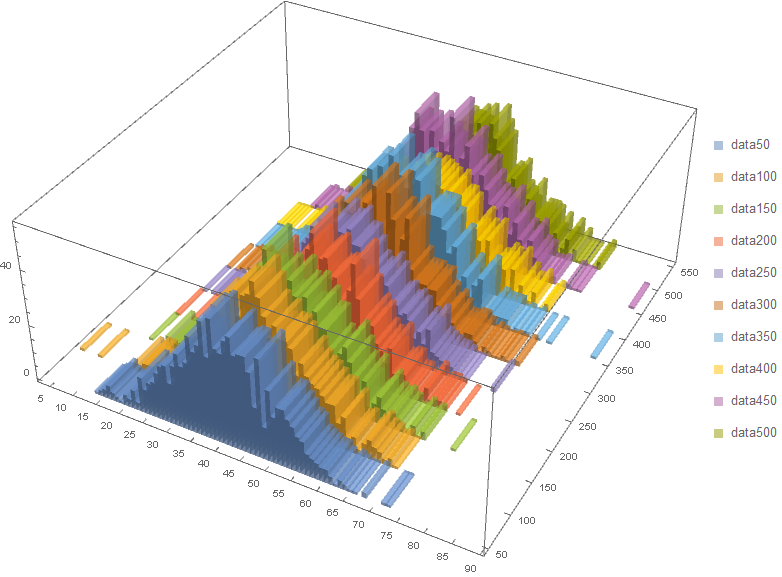
To get 66 bins for each data set, we can chart each set separately and combine the charts with Show:
Show[MapIndexed[Histogram3D[#, {{"Raw", 66}, {50}}, "Count",
    ChartBaseStyle -> Opacity[.5],
    ChartStyle -> ColorData[97][#2[[1]]],
    ChartLegends -> {"data" <> ToString[50 #2[[1]]]}] &, idts[[;; 10]]],
 PlotRange -> All, ImageSize -> 700,
 Ticks -> {Range[0, 100, 5], Range[0, 2000, 50], Automatic}]
Alternative Visualizations:
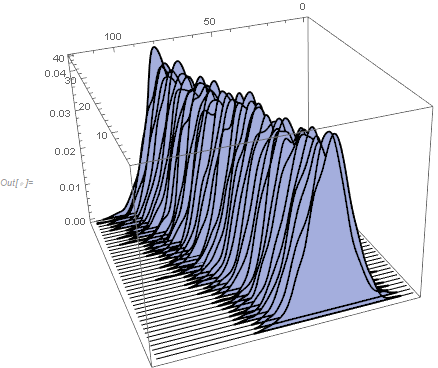
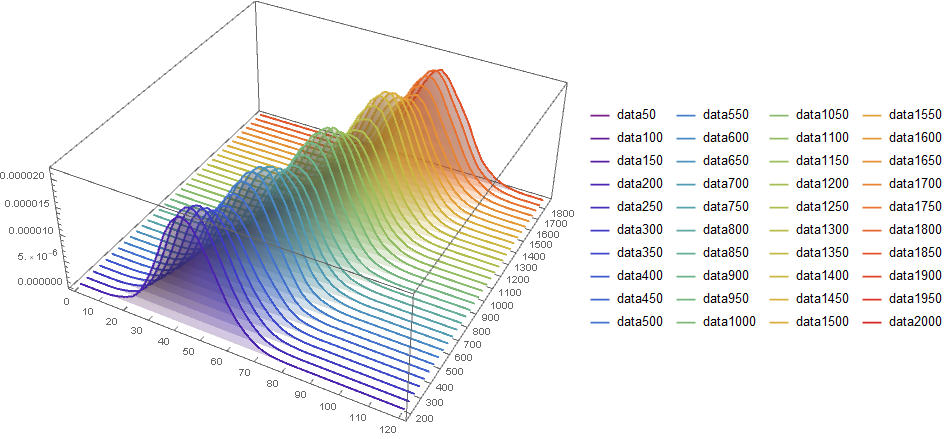
SmoothHistogram3D
SmoothHistogram3D[Join @@ idts, MeshFunctions -> {#2 &},
  Mesh -> {{50 #, Directive[Thick, ColorData[{"Rainbow", {1, nd}}]@#]} & /@
     Range[nd]},
  PlotStyle -> None, BoundaryStyle -> None,
  ImageSize -> Large,
  PlotLegends -> LineLegend["Rainbow", "data" <> ToString[50 #] & /@ Range[nd]],
  PlotRange -> {{0, 120}, Automatic, Automatic},
  Ticks -> {Range[0, 120, 10], Range[0, 2000, 100], Automatic}] /.
 Line[x_] :> {Line[x], Opacity[.25], EdgeForm[], Polygon[x]}
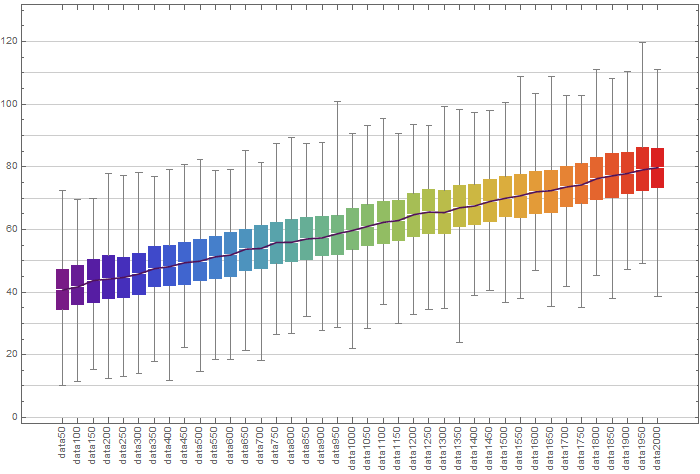
BoxWhiskerChart
BoxWhiskerChart[dts, ChartStyle -> "Rainbow",
 GridLines -> {None, Range[0, 120, 10]}, ImageSize -> 700 ,
 ChartLabels -> (Rotate[Row[{"data", 50 #}], 90 Degree] & /@ Range[nd]),
 Joined -> True]
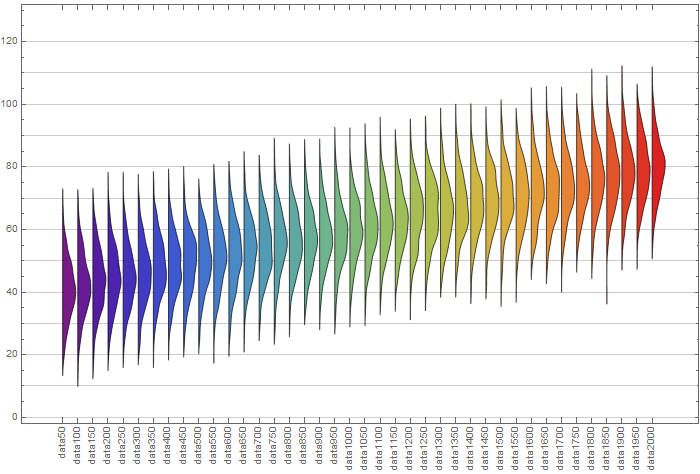
DistributionChart
DistributionChart[dts, ChartStyle -> "Rainbow",
 GridLines -> {None, Range[0, 120, 10]},
 ChartElementFunction -> ChartElementDataFunction["SmoothDensity",
   "Shape" -> "SingleSided"],
 ImageSize -> 700 ,
 ChartLabels -> (Rotate[Row[{"data", 50 #}], 90 Degree] & /@ Range[nd])]
