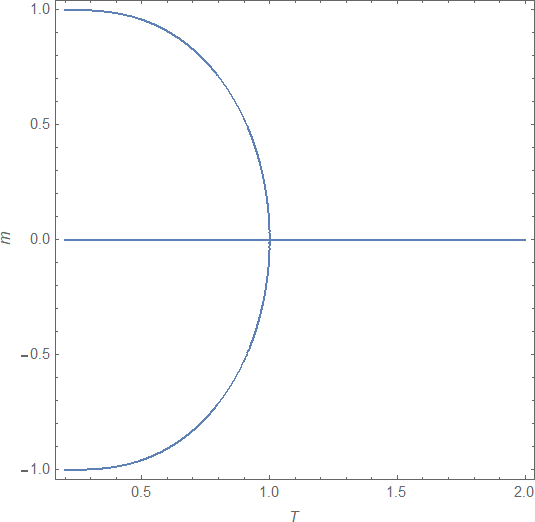
I'm using the mean field theory approximation and the Ising Model for magnetization to come up with the following equation:
m(T) = tanh(m(T)/T)
where T is an arbitrary temperature
I'm now trying to plot the left side of the equation (m(T)) and the right side of the equation (tanh(m(T)/T) over a range of x -> [-2,2], y-> [-1.1, 1.1], T -> [0.2,2] in steps of 0,2
Separately I also want to graph the solution m(T) = tanh(m(T)/T) for T -> [0,2] as a continuous function
What syntax would I use?


FindRoot. $\endgroup$ContourPlot. Also, I don't understand how the range ofxandyenters into plotting an equation that contains noxory. $\endgroup$x,y, andT$\endgroup$