0
$\begingroup$

From a matrix m={{1, 1}, {-1, 1}}, a vector b={1, 2}, and a list of variables vars={x,y} we can generate a list of linear equations using the matrix equation m.vars==b which gives {x+y,-x+y}=={1,2}. How do I transform equations into eqs={1-x,x+2}? In other words how do I solve for y = rhs but only returning the rhs? I tried different things including picking parts with Part and ReplaceAll rules and transformations but none worked.

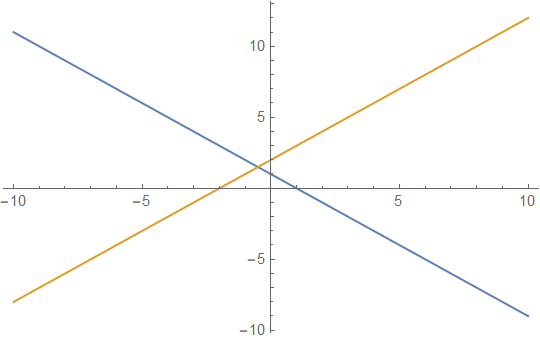
The reason I want equations in rhs form is that I figured out how to "visualize" linear equations using Plot. All other tutorials including Wolfram documentation and published books use ContourPlot or graphics primitives Line for this which I find too cumbersome for plotting the simplest of functions derived from matrix equations. With Plot it is very easy to do Plot[eqs,{x,-10,10}].

Here is my code to facilitate a solution...

ClearAll[m,b,eqs,vars,x,y];
vars = {x,y};
m = {{1, 1}, {-1, 1}};
b = {1, 2};
eqs = m.vars == b;

the solution should be equivalent to this...

eqs = {-x+1, x+2};
Plot[eqs, {x, -10, 10}]

enter image description here

$\endgroup$
0

2 Answers 2

3
$\begingroup$

This does what you want, but I am not sure that it is better than a ContourPlot approach in any meaningful way:

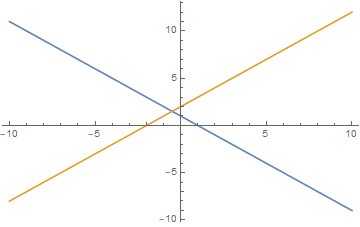
Plot[Evaluate[y /. First@Solve[#, y] & /@ Thread@eqs], {x, -10, 10}]

enter image description here

$\endgroup$
6
  • $\begingroup$ Thank you for coming through for me again. I will give your solution a green check mark (Accept) after giving others a a good full day to answer this. $\endgroup$ Commented Aug 4, 2020 at 20:06
  • $\begingroup$ @JulesManson You are very welcome! $\endgroup$
    – MarcoB
    Commented Aug 4, 2020 at 20:26
  • $\begingroup$ I prefer Plot for its most natural appearance especially the axes placement and styles. Unless I am mistaken axes placement in ContourPlot tends to be on the frame which I don't like. $\endgroup$ Commented Aug 4, 2020 at 21:35
  • 3
    $\begingroup$ @JulesManson - Frame and Axes are options for all of the 2D plotting functions. If you don't like the defaults, specify your preferences, e.g., eqs = Thread[m.vars == b]; ContourPlot[Evaluate@eqs, {x, -10, 10}, {y, -10, 10}, Frame -> False, Axes -> True] $\endgroup$
    – Bob Hanlon
    Commented Aug 4, 2020 at 22:33
  • $\begingroup$ @BobHanlon thanks for the tip. $\endgroup$ Commented Aug 4, 2020 at 23:59
2
$\begingroup$

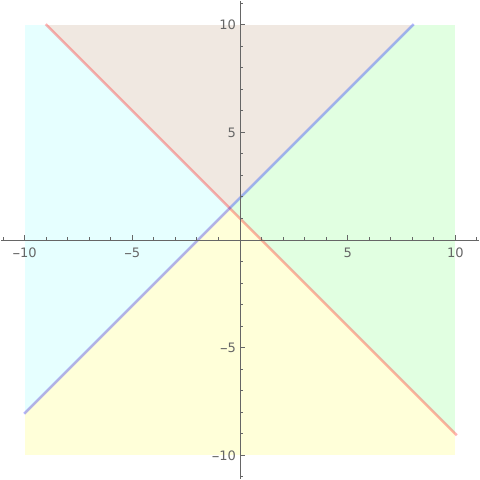
Not an answer,just a another thinking.

Clear["`*"];
m = {{1, 1}, {-1, 1}};
vars = {x, y};
b = {1, 2};
eqs = m.vars - b // Evaluate;
ParametricPlot[{u, v}, {u, -10, 10}, {v, -10, 10}, 
 MeshFunctions -> (Function[{x, y}, #] & /@ eqs), Mesh -> {{0}}, 
 MeshShading -> {{LightYellow, LightGreen}, {LightCyan, LightBrown}}, 
 PlotStyle -> None, MeshStyle -> {{Thick, Red}, {Thick, Blue}}, 
 Frame -> False, BoundaryStyle -> None]

enter image description here

$\endgroup$
1
  • $\begingroup$ that is beautiful work. i might steal that. $\endgroup$ Commented Aug 18, 2020 at 11:27

Your Answer

By clicking “Post Your Answer”, you agree to our terms of service and acknowledge you have read our privacy policy.

Not the answer you're looking for? Browse other questions tagged or ask your own question.