added 1 character in body
Source Link
Jules Manson
  • 2.5k
  • 11
  • 19

From a matrix m={{1, 1}, {-1, 1}}, a vector b={1, 2}, and a list of variables vars={x,y} we can generate a list of linear equations using the matrix equation m.vars==b which gives {x+y,-x+y}=={1,2}. How do I transform equations into eqs={1-x,x+2}? In other words how do I solve for y = rhs but only returning the rhs? I tried different things including picking parts with Part and ReplaceAll rules and transformations but none worked.

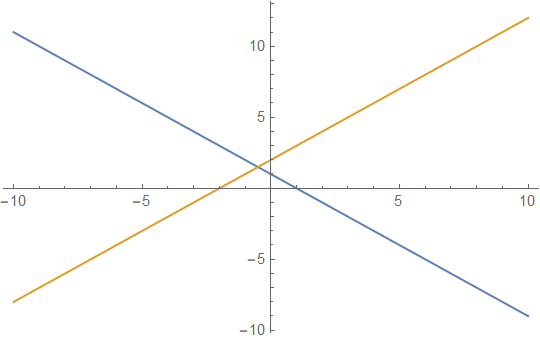
The reason I want equations in rhs form is that I figured out how to "visualize" linear equations using Plot. All other tutorials including Wolfram documentation and published books use ContourPlot or graphics primitives Line for this which I find too cumbersome for plotting the simplest of functions derived from matrix equations. With Plot it is very easy to do Plot[eqs,{x,-10,10}].

Here is my code to facilitate a solution...

ClearAll[m,b,eqs,vars,x,y];
vars = {x,y};
m = {{1, 1}, {-1, 1}};
b = {1, 2};
eqs = m.vars == b;

the solution should be equivalent to this...

eqs = {1-xx+1, x+2};
Plot[eqs, {x, -10, 10}]

enter image description here

From a matrix m={{1, 1}, {-1, 1}}, a vector b={1, 2}, and a list of variables vars={x,y} we can generate a list of linear equations using the matrix equation m.vars==b which gives {x+y,-x+y}=={1,2}. How do I transform equations into eqs={1-x,x+2}? In other words how do I solve for y = rhs but only returning the rhs? I tried different things including picking parts with Part and ReplaceAll rules and transformations but none worked.

The reason I want equations in rhs form is that I figured out how to "visualize" linear equations using Plot. All other tutorials including Wolfram documentation and published books use ContourPlot or graphics primitives Line for this which I find too cumbersome for plotting the simplest of functions derived from matrix equations. With Plot it is very easy to do Plot[eqs,{x,-10,10}].

Here is my code to facilitate a solution...

ClearAll[m,b,eqs,vars,x,y];
vars = {x,y};
m = {{1, 1}, {-1, 1}};
b = {1, 2};
eqs = m.vars == b;

the solution should be equivalent to this...

eqs = {1-x, x+2};
Plot[eqs, {x, -10, 10}]

enter image description here

From a matrix m={{1, 1}, {-1, 1}}, a vector b={1, 2}, and a list of variables vars={x,y} we can generate a list of linear equations using the matrix equation m.vars==b which gives {x+y,-x+y}=={1,2}. How do I transform equations into eqs={1-x,x+2}? In other words how do I solve for y = rhs but only returning the rhs? I tried different things including picking parts with Part and ReplaceAll rules and transformations but none worked.

The reason I want equations in rhs form is that I figured out how to "visualize" linear equations using Plot. All other tutorials including Wolfram documentation and published books use ContourPlot or graphics primitives Line for this which I find too cumbersome for plotting the simplest of functions derived from matrix equations. With Plot it is very easy to do Plot[eqs,{x,-10,10}].

Here is my code to facilitate a solution...

ClearAll[m,b,eqs,vars,x,y];
vars = {x,y};
m = {{1, 1}, {-1, 1}};
b = {1, 2};
eqs = m.vars == b;

the solution should be equivalent to this...

eqs = {-x+1, x+2};
Plot[eqs, {x, -10, 10}]

enter image description here

added 31 characters in body
Source Link
Jules Manson
  • 2.5k
  • 11
  • 19

From a matrix m={{1, 1}, {-1, 1}}, a vector b={1, 2}, and a list of variables vars={x,y} we can generate a list of linear equations using the matrix equation m.vars==b which gives {x+y,-x+y}=={1,2}. How do I transform equations into eqs={1-x,x+2}? In other words how do I solve for y = rhs but only returning the rhs? I tried different things including picking parts with Part and ReplaceAll rules and transformations but none worked.

The reason I want equations in rhs form is that I figured out how to "visualize" linear equations using Plot. All other tutorials including Wolfram documentation and published books use ContourPlot or graphics primitives Line for this which I find too cumbersome for some ofplotting the simplest of functions derived from matrix equations. With Plot it is very easy to do Plot[eqs,{x,-10,10}].

Here is my code to facilitate a solution...

ClearAll[m,b,eqs,vars,x,y];
vars = {x,y};
m = {{1, 1}, {-1, 1}};
b = {1, 2};
eqs = m.vars == b;

the solution should be equivalent to this...

eqs = {1-x, x+2};
Plot[eqs, {x, -10, 10}]

enter image description here

From a matrix m={{1, 1}, {-1, 1}}, a vector b={1, 2}, and a list of variables vars={x,y} we can generate a list of linear equations using the matrix equation m.vars==b which gives {x+y,-x+y}=={1,2}. How do I transform equations into eqs={1-x,x+2}? In other words how do I solve for y = rhs but only returning the rhs? I tried different things including picking parts with Part and ReplaceAll rules and transformations but none worked.

The reason I want equations in rhs form is that I figured out how to "visualize" linear equations using Plot. All other tutorials including Wolfram documentation and published books use ContourPlot or graphics primitives Line for this which I find too cumbersome for some of the simplest of functions. With Plot it is very easy to do Plot[eqs,{x,-10,10}].

Here is my code to facilitate a solution...

ClearAll[m,b,eqs,vars,x,y];
vars = {x,y};
m = {{1, 1}, {-1, 1}};
b = {1, 2};
eqs = m.vars == b;

the solution should be equivalent to this...

eqs = {1-x, x+2};
Plot[eqs, {x, -10, 10}]

enter image description here

From a matrix m={{1, 1}, {-1, 1}}, a vector b={1, 2}, and a list of variables vars={x,y} we can generate a list of linear equations using the matrix equation m.vars==b which gives {x+y,-x+y}=={1,2}. How do I transform equations into eqs={1-x,x+2}? In other words how do I solve for y = rhs but only returning the rhs? I tried different things including picking parts with Part and ReplaceAll rules and transformations but none worked.

The reason I want equations in rhs form is that I figured out how to "visualize" linear equations using Plot. All other tutorials including Wolfram documentation and published books use ContourPlot or graphics primitives Line for this which I find too cumbersome for plotting the simplest of functions derived from matrix equations. With Plot it is very easy to do Plot[eqs,{x,-10,10}].

Here is my code to facilitate a solution...

ClearAll[m,b,eqs,vars,x,y];
vars = {x,y};
m = {{1, 1}, {-1, 1}};
b = {1, 2};
eqs = m.vars == b;

the solution should be equivalent to this...

eqs = {1-x, x+2};
Plot[eqs, {x, -10, 10}]

enter image description here

clarification
Source Link
Jules Manson
  • 2.5k
  • 11
  • 19

From a matrix m={{1, 1}, {-1, 1}}, a vector b={1, 2}, and a list of variables vars={x,y} we can generate a list of linear equations using the matrix equation m.vars==b which gives {x+y,-x+y}=={1,2}. How do I transform equations into eqs={1-x,x+2}? In other words how do I solve for y = rhs but only returning the rhs? I tried different things including picking parts with Part and ReplaceAll rules and transformations but none worked.

The reason I want equations in rhs form is that I figured out how to "visualize" linear equations using Plot. All other tutorials including Wolfram documentation and published books use ContourPlot or graphics primitives Line for this which I find too cumbersome for some of the simplest of functions. With Plot it is very easy to do Plot[eqs,{x,-10,10}].

Here is my code to facilitate a solution...

ClearAll[m,b,eqs,vars,x,y];
vars = {x,y};
m = {{1, 1}, {-1, 1}};
b = {1, 2};
eqs = m.vars == b;

the solution should be equivalent to this...

eqs = {1-x, x+2};
Plot[eqs, {x, -10, 10}]

enter image description here

From a matrix m={{1, 1}, {-1, 1}}, a vector b={1, 2}, and a list of variables vars={x,y} we can generate a list of linear equations using the matrix equation m.vars==b which gives {x+y,-x+y}=={1,2}. How do I transform equations into eqs={1-x,x+2}? In other words how do I solve for y = rhs but only returning the rhs? I tried different things including picking parts with Part and ReplaceAll rules and transformations but none worked.

The reason I want equations in rhs form is that I figured out how to "visualize" linear equations using Plot. All other tutorials including Wolfram documentation and published books use ContourPlot or graphics primitives Line for this which I find too cumbersome for some of the simplest of functions. With Plot it is very easy to do Plot[eqs,{x,-10,10}].

Here is my code to facilitate a solution...

ClearAll[m,b,eqs,vars,x,y];
vars = {x,y};
m = {{1, 1}, {-1, 1}};
b = {1, 2};
eqs = m.vars == b;

the solution should be equivalent to this...

eqs = {1-x, x+2};
Plot[eqs, {x, -10, 10}]

enter image description here

clarification
Source Link
Jules Manson
  • 2.5k
  • 11
  • 19
Loading
Source Link
Jules Manson
  • 2.5k
  • 11
  • 19
Loading