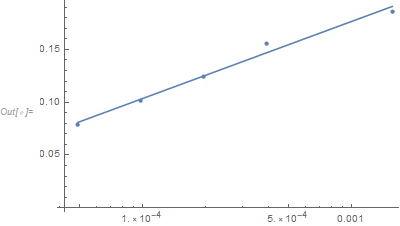
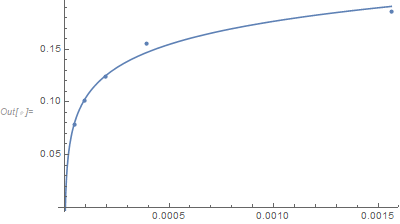
I have five data sets, {4.88281 10^(-5), 0.0788}, {9.76563 10^(-5), 0.1014}, {0.000195313, 0.12455}, {0.000390625, 0.15594}, {0.0015625, 0.18587}. I was using EXCEL to add the trendline, but the x intercept is a negative value. I wanted to fit the trendline close to zero but don't include (0,0) in my plot, can I get this done with Mathematica?
Thanks!


LinearModelFitorNonlinearModelFit. $\endgroup$FindFit[data,{expr,cons},pars,vars], you can add a constraint. $\endgroup$