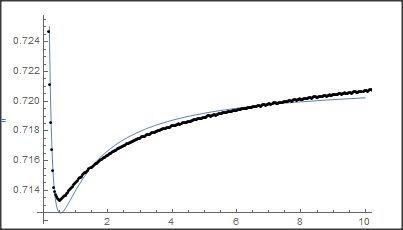
Consider a dataset in the form {mN,tauN,x,value[mN,tauN,x]} (it may be downloaded here):
data = Import["dataset-low-masses-1.dat", "Table"];
(*Values of mN and tauN*)
MassesLifetimesRange =
 DeleteDuplicatesBy[data, {#[[1]], #[[2]]} &][[All, {1, 2}]]
(*Table x, value for the given mN, tauN*)
dataselected[i_] :=
 Select[data, #[[1]] == MassesLifetimesRange[[i]][[1]] && #[[2]] ==
      MassesLifetimesRange[[i]][[2]] &][[All, {3, 4}]]
I would like to fit the data. In order to do this, first I wand to get the shape of the fit for fixed mN, tauN. I'm trying to do this using fractional polynomial:
ivv = 1;
dataselectedi = dataselected[ivv];
fit22 = NonlinearModelFit[dataselectedi, (
   a + b*pToT + c1*(pToT^2)(*+d*pToT^3*))/(
   g + f*pToT + t*(pToT^2)(*+m*pToT^3+h*pToT^4*)), {a, b, c1, d, f, g,
     t, m, h}, {pToT}];
In fit22, I may uncomment additional summands. In general, it fits well, but for some values of ivv the fit shows discontinuity:
Show[LogLogPlot[{fit22[pToT]}, {pToT, 0.15, 7}, Frame -> True,
  FrameStyle -> Directive[Black, 22], PlotRange -> {{0.15, 6}, All},
  PlotLegends -> Placed[Style[#, 20] & /@ {"Fit"}, {0.8, 0.2}],
  PlotLabel ->
   Style[Row[{"\!\(\*SubscriptBox[\(m\), \(N\)]\) = ",
      MassesLifetimesRange[[ivv]][[1]],
      " GeV, \!\(\*SubscriptBox[\(\[Tau]\), \(N\)]\) = ",
      MassesLifetimesRange[[ivv]][[2]], " s"}], 20, Black],
  PlotStyle -> {{Thickness[0.003], Blue}, {Thickness[0.003], Red}},
  PlotRange -> All, ImageSize -> Large,
  FrameLabel -> {"p/\!\(\*SubscriptBox[\(T\), \(final\)]\)",
    "\!\(\*SubscriptBox[\(T\), \(eff\)]\)/\!\(\*SubscriptBox[\(T\), \
\(final\)]\)"}, FillingStyle -> Lighter@Lighter@Gray],
 ListLogLogPlot[dataselected[ivv], Frame -> True,
  FrameStyle -> Directive[Black, 22], PlotRange -> {{0.1, 6}, All},
  PlotLegends -> Placed[Style[#, 20] & /@ {"Data"}, {0.8, 0.2}],
  PlotLabel ->
   Style[Row[{"\!\(\*SubscriptBox[\(m\), \(N\)]\) = ",
      MassesLifetimesRange[[ivv]][[1]],
      " GeV, \!\(\*SubscriptBox[\(\[Tau]\), \(N\)]\) = ",
      MassesLifetimesRange[[ivv]][[2]], " s"}], 20, Black],
  PlotStyle -> {{Thickness[0.003], Blue}}, PlotRange -> All,
  ImageSize -> Large,
  FrameLabel -> {"\!\(\*SubscriptBox[\(p\), \
\(physical\)]\)/\!\(\*SubscriptBox[\(T\), \(final\)]\)",
    "\!\(\*SubscriptBox[\(T\), \(eff\)]\)/\!\(\*SubscriptBox[\(T\), \
\(final\)]\)"}]]
The left plot is for ivv =1, the middle plot is for ivv = 9, the right plot is for ivv = 10.

If including some of the commented terms in the fit, I get the discontinuity for another value of ivv...
Could you please tell me how to deal with this? Also, is there any possible way for Mathematica to derive the fit function shape by itself, without trial-and-error?

