Here is my code.
data contains list of edges of a graph. For example the first edge is 5->8 which means the edge has end points 5 and 8. The order of edges is important for me, although the graph would look the same even if the order of edges was different.
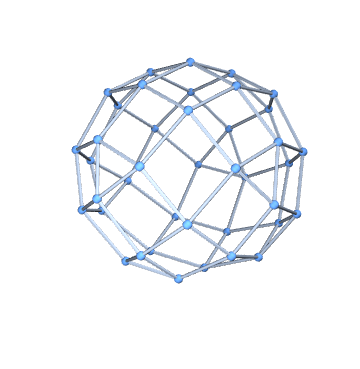
gr contains the plot of the graph. You can use FullForm[gr] to see what it consists of.
coordinates contains coordinates of points extracted form the plot.
edges contains edges extracted from the plot.
data = {5 -> 8, 8 -> 11, 11 -> 14, 14 -> 17, 17 -> 20, 20 -> 30,
   30 -> 32, 32 -> 34, 34 -> 36, 36 -> 38, 38 -> 3, 3 -> 6, 6 -> 9,
   9 -> 12, 12 -> 17, 17 -> 19, 19 -> 21, 21 -> 23, 23 -> 25,
   25 -> 35, 35 -> 38, 38 -> 1, 1 -> 4, 4 -> 7, 7 -> 10, 10 -> 20,
   20 -> 22, 22 -> 24, 24 -> 26, 26 -> 28, 28 -> 33, 33 -> 36,
   36 -> 39, 39 -> 2, 2 -> 7, 7 -> 9, 9 -> 11, 11 -> 13, 13 -> 15,
   15 -> 25, 25 -> 28, 28 -> 31, 31 -> 34, 34 -> 37, 37 -> 40,
   40 -> 10, 10 -> 12, 12 -> 14, 14 -> 16, 16 -> 18, 18 -> 23,
   23 -> 26, 26 -> 29, 29 -> 32, 32 -> 37, 37 -> 39, 39 -> 1, 1 -> 3,
   3 -> 5, 5 -> 15, 15 -> 18, 18 -> 21, 21 -> 24, 24 -> 27, 27 -> 30,
   30 -> 40, 40 -> 2, 2 -> 4, 4 -> 6, 6 -> 8, 8 -> 13, 13 -> 16,
   16 -> 19, 19 -> 22, 22 -> 27, 27 -> 29, 29 -> 31, 31 -> 33,
   33 -> 35, 35 -> 5};
gr = GraphPlot3D[data, Method -> "SpringEmbedding"]
coordinates = gr[[1, 1]]
edges = gr[[1, 2, 1, 2, 1]]
Output:
{{2.15099, 1.18307, 3.11637}, {3.04554, 0.934916, 2.56025}, {3.55454,
  1.21541, 1.90224}, {3.64482, 1.99867, 1.19894}, {3.2115, 2.38972,
  0.549773}, {2.28274, 2.36187, 0.00260647}, {1.28767, 2.28706,
  0.00272485}, {0.379458, 2.18177, 0.552232}, {0., 1.64516,
  1.20573}, {0.226403, 0.985251, 1.912}, {0.946206, 0.603301,
  2.56797}, {1.83231, 0.329511, 2.56276}, {2.65923, 0.220807,
  1.90275}, {3.17392, 0.63046, 1.19994}, {3.26151, 1.46478,
  0.547847}, {3.0135, 3.17375, 1.21467}, {2.42955, 3.54417,
  1.92239}, {1.82077, 3.30175, 2.57303}, {1.50578, 2.44273,
  3.11857}, {1.19737, 1.49462, 3.11698}, {1.21934, 0.0929668,
  1.91297}, {1.99693, 0., 1.20222}, {2.38452, 0.434066,
  0.545737}, {2.3541, 1.36368, 0.}, {2.18052, 3.26543,
  0.558385}, {1.64804, 3.64083, 1.21331}, {0.991134, 3.41471,
  1.91654}, {0.612497, 2.69602, 2.57153}, {0.339418, 1.81279,
  2.56705}, {0.632563, 0.468973, 1.20897}, {1.46275, 0.38174,
  0.550977}, {3.31226, 1.81971, 2.56268}, {2.45549, 2.13245,
  3.11539}, {0.0986677, 2.42307, 1.91563}, {0.434602, 1.25784,
  0.551964}, {1.36011, 1.29101, 0.00233058}, {3.42145, 2.65132,
  1.9113}, {2.70536, 3.02741, 2.57249}, {0.471524, 3.01036,
  1.21356}, {1.25737, 3.2109, 0.556519}}

{{1,2},{1,12},{1,20},{1,33},{2,3},{2,13},{2,32},{3,4},{3,14},{3,32},{4,5},{4,15},{4,37},{5,6},{5,15},{5,16},{6,7},{6,24},{6,25},{7,8},{7,36},{7,40},{8,9},{8,35},{8,39},{9,10},{9,34},{9,35},{10,11},{10,29},{10,30},{11,12},{11,20},{11,21},{12,13},{12,21},{13,14},{13,22},{14,15},{14,23},{15,24},{16,17},{16,25},{16,37},{17,18},{17,26},{17,38},{18,19},{18,27},{18,38},{19,20},{19,28},{19,33},{20,29},{21,22},{21,30},{22,23},{22,31},{23,24},{23,31},{24,36},{25,26},{25,40},{26,27},{26,40},{27,28},{27,39},{28,29},{28,34},{29,34},{30,31},{30,35},{31,36},{32,33},{32,37},{33,38},{34,39},{35,36},{37,38},{39,40}}
Now you can see that order of the edges that was in my original data is different in output edges.
But I need to know what coordinates belong to what point. For example what are coordinates of end points of my edge 5->8?
I consider it to be a bug, that the order of edges was nor preserved, otherwise I would be able to identify coordinate of each point/edge. Is there some way to do it automatically? I can do it manually but that is very time consuming.
EDIT 1: Maybe I accepted flinty's answer too early or I am doing something wrong but the points still does not seem to be ordered correctly.
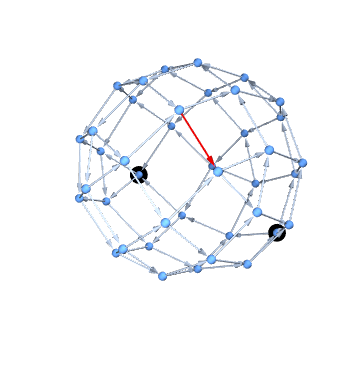
Try the following code which highlights edge 5->8 and also plots points 5 and 8 according to their coordinates. But the highlighted edge does not correspond to these points:
gr = Graph3D[data, GraphLayout -> "SpringEmbedding"]
Show[{HighlightGraph[gr, 5 -> 8],
  Graphics3D[{PointSize[0.05], Point[GraphEmbedding[gr][[{5, 8}]]]}]}]
Output:
So did I do something wrong or I am right that the Mathematica's ordering is wrong?
EDIT 2:
Problem in "edit 1" is resolved with VertexList[gr] as flinty explains in his comment.


