1
$\begingroup$

I have a plot generated by:

ListPointPlot3D[data -> labels, PlotTheme -> "Scientific",  LabelingFunction -> Center]

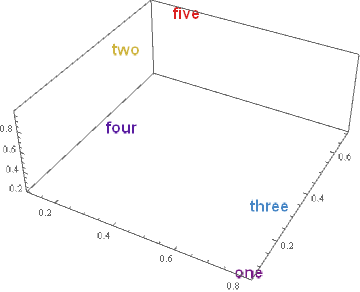
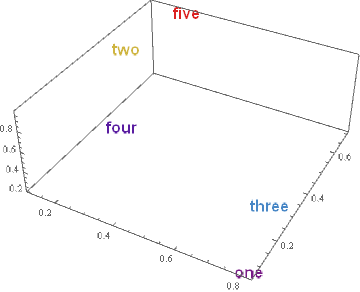
and I want to color the data labels. ColorFunction would work if LabelingFunction was not included. Is there a way to change the color with LabelingFunction included?

If the code is:

SeedRandom[1234567];
data = RandomPoint[Cube[], 5];
ListPointPlot3D[data, PlotTheme -> "Scientific", Boxed -> False, 
 LabelingFunction -> Center]

Is there a way to just assign colors to the labels in the style they are in without the data points showing?

$\endgroup$

1 Answer 1

1
$\begingroup$
SeedRandom[1]
data = RandomPoint[Cuboid[], 5];
labels = IntegerName /@ Range[5];

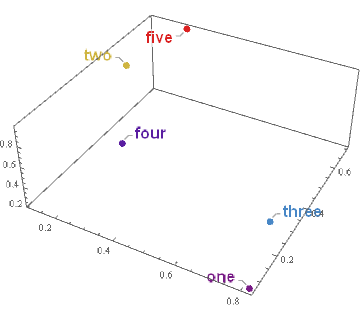
ListPointPlot3D[(List /@ data) -> labels, PlotTheme -> "Scientific", 
 LabelingFunction -> (Style[#3[[2, 1]], 16, Bold, FontFamily -> "Arial", 
     ColorData["Rainbow"][Rescale[Last@#, MinMax[data[[All, 3]]], {0, 1}]]] &), 
 ColorFunction -> "Rainbow", PlotStyle -> PointSize[Large]]

enter image description here

Update: "to assign colors to the labels in the style they are in without the data points showing":

labeleddata = MapThread[
   Labeled[#, Style[#2, 16, Bold, FontFamily -> "Arial", 
     ColorData["Rainbow"][Rescale[Last@#, MinMax[data[[All, 3]]], {0, 1}]]], Center] &,
   {data, labels}];

ListPointPlot3D[labeleddata, PlotTheme -> "Scientific"]

enter image description here

If you have to use LabelingFunction you can do:

ListPointPlot3D[data -> labels, PlotTheme -> "Scientific", 
 LabelingFunction -> (Placed[#, Center] &@
     Style[#3[[3, 1]], 16, Bold, FontFamily -> "Arial", 
      ColorData["Rainbow"][Rescale[Last@#, MinMax[data[[All, 3]]], {0, 1}]]] &)]

enter image description here

$\endgroup$

Your Answer

By clicking “Post Your Answer”, you agree to our terms of service and acknowledge you have read our privacy policy.

Not the answer you're looking for? Browse other questions tagged or ask your own question.