I have a number with certain uncertainty
a1 = Around[1, 0.1]
I try to plot a function with this number
Plot[a1*x, {x, 0, 1}]
However nothing happened.
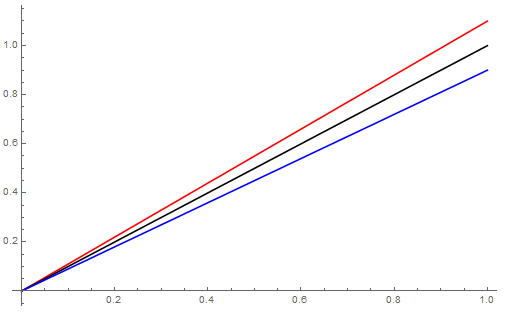
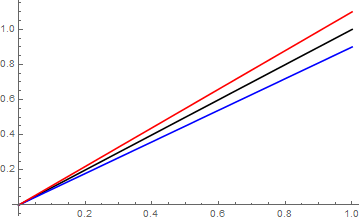
I was looking for something similar to this (the colour is not necessary):
a = Plot[1.1*x, {x, 0, 1}, PlotStyle -> Red];
b = Plot[1*x, {x, 0, 1}, PlotStyle -> Black];
c = Plot[0.9*x, {x, 0, 1}, PlotStyle -> Blue];
Show[a, b, c]
Question 1
There is some way to make that the first plot appears? Or there is some more efficient method than plotting three times?
Question 2
If I have a1=Around[1,0.1] how can I get the Maximum value of a1? In this case is clear that is 1.1, however I have to obtain this value "manually"


Plus @@ Thread@ a1[{"Value", "Uncertainty"}]ora1["Value"] + a1["Uncertainty"]will give you the value + the uncertainty. That, of course, may not be the maximum value ofa1if the uncertainty is e.g. a standard deviation, but that's up to you to interpret. You may also be interested in other properties that you can extract fromAroundobjects (see the details section of its docs). $\endgroup$