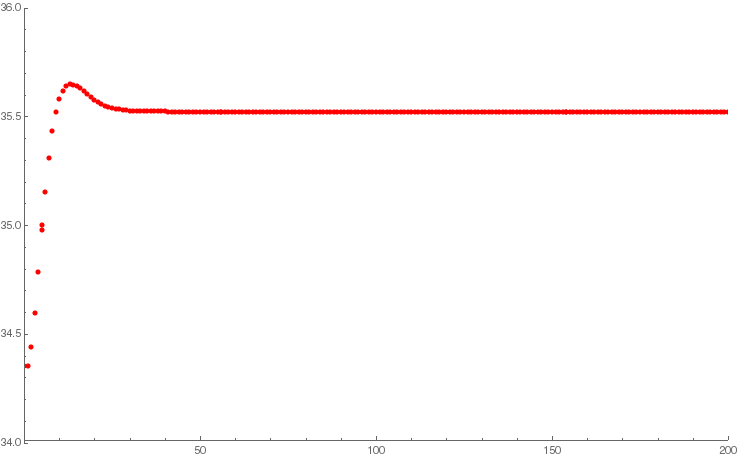
I have a data set with $(x,y)$ coordinates. I do the following to import the data
data = Import[
   "plot.txt", "Table"];
x = data[[All, 2]]-250;
y = data[[All, 1]];
Newdata = Transpose[{x, y}];
p2 = ListPlot[Newdata, PlotRange -> {{0, 200}, {34, 36}},
  PlotStyle -> Red]
And I obtain the following plot 
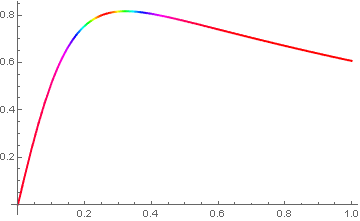
Edit: This is my attempt
intp = Interpolation[Transpose[{x, y}]];
d1[t_] := D[{s, intp[s]}, s] /. s -> t;
d2[t_] := D[{s, intp[s]}, {s, 2}] /. s -> t;
k[t_] := Det[{d1[t], d2[t]}]/Norm[d1[t]]^3;
(*find the min and max curvature so we can scale the colours*)

maxk = First[NMaximize[{k[t], 0 < t < Max[data[[All, 1]]]}, t]];
mink = First[NMinimize[{k[t], 0 < t < Max[data[[All, 1]]]}, t]];
Plot[intp[t], {t, 0, 1}, PlotStyle -> Thick, PlotRange -> All,
 ColorFunction -> Function[{t}, Hue[Rescale[k[t], {mink, maxk}]]]]
I get the following error
Interpolation:The point 14 in dimension 1 is duplicated.
Now, I would like to know why I get such an error while calculating the variation of the mean curvature along the $x$-axis. Can anyone suggest how to approach that?


