1
$\begingroup$

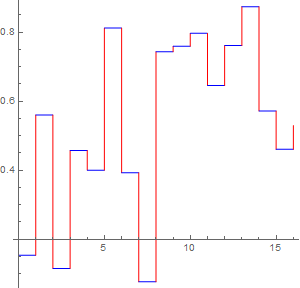
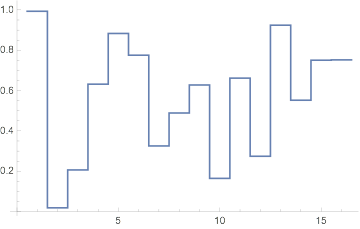
I would like to color the horizontal portions (the data) of a ListStepPlot in one style (e.g., blue) and the vertical (linking lines) in a different style (e.g., red) in a plot such as this:

d = Table[RandomReal[], 16]; (* or some other computed list *)

ListStepPlot[d, Center]

ListStepPlot

Neither Mesh nor ClippingStyle nor Exclusions are appropriate, as you can test yourself.

The option Joined-> False eliminates the vertical segments, but I want them to remain. I can kludge such a graph by plotting two: One in red with Joined->True overlapped by another in blue with Joined->False but this is very inelegant.

I need to apply this to ListStepPlot (for a number of reasons), so alternate kludges will not suffice.

$\endgroup$

2 Answers 2

4
$\begingroup$

Post-processing to re-color horizontal and vertical segments of Line primitives:

ClearAll[postProcess]
postProcess[lsp_, cols_: {Red}] := Module[{cls = cols}, 
   Replace[lsp, {a___, d_Directive, Line[x_]} :> 
     Module[{p = Partition[x, 2, 1], d2 = d /. _?ColorQ -> Last[cls = RotateLeft[cls]]}, 
      {a, d, Line[p[[;; ;; 2]]], d2, Line[p[[2 ;; ;; 2]]]}], All]];

Examples:

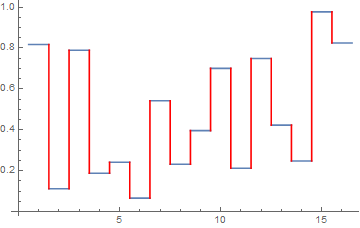
SeedRandom[1]
d = Table[RandomReal[], 16];

postProcess[ListStepPlot[d, Center]]

enter image description here

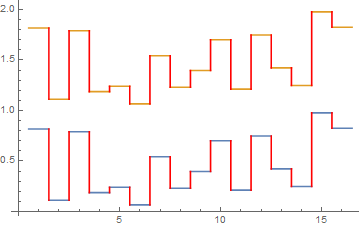
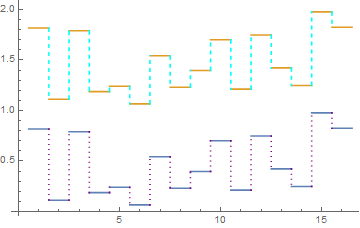
postProcess[ListStepPlot[{d, 1 + d}, Center]]

enter image description here

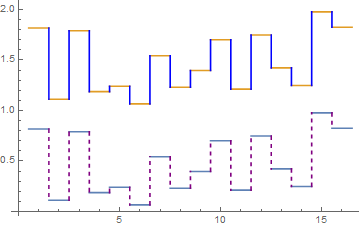
postProcess[ListStepPlot[{d, 1 + d}, Center], {Directive[Dashed, Purple], Blue}]

enter image description here

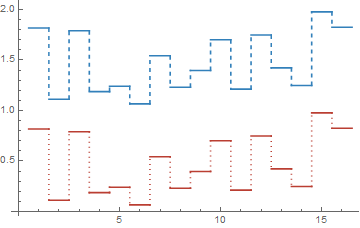
postProcess[#, {Dotted, Dashed}] & @
 ListStepPlot[{d, d + 1}, Center, PlotStyle -> 63]

enter image description here

You can use the function postProcess in two ways:

  1. wrap ListStepPlot with postProcess as in the examples above, or
  2. use it as the option value for the option DisplayFunction.

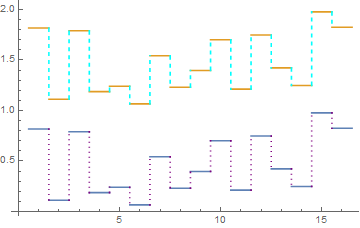
postProcess[#, {Directive[Dotted, Purple], Directive[Dashed, Cyan]}] & @ 
  ListStepPlot[{d, d + 1}, Center]

enter image description here

ListStepPlot[{d, d + 1}, Center, 
 DisplayFunction -> 
   (postProcess[#, {Directive[Dotted, Purple],   Directive[Dashed, Cyan]}] &)]

enter image description here

$\endgroup$
1
  • 1
    $\begingroup$ I knew I could count on you! ($\checkmark$) $\endgroup$ Commented Apr 8, 2020 at 15:50
1
$\begingroup$

May be

z0 = RandomReal[];
d = Table[z = RandomReal[];
   o = {
     {Blue, Line[{{i - 1, z0}, {i, z0}}]},
     {Red, Line[{{i, z0}, {i, z}}]}
     };
   z0 = z;
   o,
   {i, 16}];

Graphics[d, AspectRatio -> 1, ImageSize -> 300, Axes -> True]

Mathematica graphics

$\endgroup$
1
  • $\begingroup$ Thanks, but not quite. There are innumerable ways to achieve this (as I and you have found), but as I mentioned I need to apply it to ListStepPlot. (I'll be combining lots of plots, preserving data format, etc., etc.) Any suggestions? $\endgroup$ Commented Apr 8, 2020 at 1:08

Your Answer

By clicking “Post Your Answer”, you agree to our terms of service and acknowledge you have read our privacy policy.

Not the answer you're looking for? Browse other questions tagged or ask your own question.