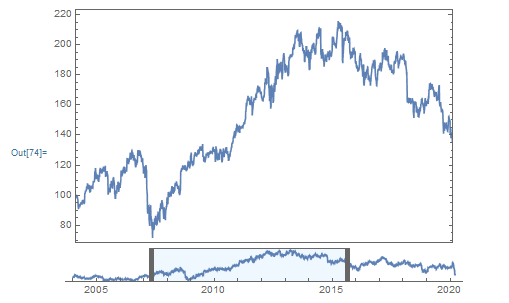
Finally I managed to make it by myself.
DynamicModule[{data, xmin, xmax, ymin, ymax, int, w = 400, h = 30},
 data = FinancialData["IBM", "Jan. 1, 2004"];
 {ymin, ymax} = QuantityMagnitude@MinMax[data];
 {xmin, xmax} = {data["FirstTime"], data["LastTime"]};
 Column[{Show[DateListPlot[data, ImageSize -> w, Joined -> True],
    PlotRange -> {Dynamic[int], {ymin, ymax}}],
   Row[{
     Spacer[10],
     Deploy[DateListPlot[data,
       Prolog -> {Opacity[0.4], EdgeForm[{Thick, GrayLevel[0.4]}],
         LightBlue,
         Dynamic[Rectangle @@ Thread[{int, {ymin - 5, ymax + 5}}]]},
       Epilog -> {Inset[
          IntervalSlider[Dynamic[int], {xmin, xmax, 1}, Appearance -> {
             "ThumbAppearance" -> {
               Graphics[{
                 AbsoluteThickness@5, GrayLevel[0.4],
                 Line@{{0, 0}, {0, 1}}
                 }], None,
               Graphics[{
                 AbsoluteThickness@5, GrayLevel[0.4],
                 Line@{{0, 0}, {0, 1}}
                 }]
               }, "BarAppearance" -> None
             }, ImageSize -> {400, 50}, Method -> "Stop",
           MinIntervalSize -> 1], Scaled[{0.5, 0.6}]]},
       Frame -> False, Axes -> {True, False},
       PlotRange -> {ymin, ymax}, ImageSize -> {400, 50},
       AspectRatio -> 0.08, Joined -> True]
      ]
     }]
   }]]

EDIT:
When I apply this to my Manipulate, the coordinates in Dynamic[Rectangle @@ Thread[{int, {ymin - 5, ymax + 5}}]] need to be Scaled, otherwise nothing is displayed, I don't know why.
Also, my timeseries has irregular interval, I need to use AbsoluteTime@DateObject[*data list*] to make it function correctly.
Reference:
Slider moving in irregular steps
Make a time IntervalSlider
EDIT2:
There is still a problem, which is the top and bottom edge of the rectangle in intervalslider is clipped. You may use
GrayLevel[0.6], Inset@
 Framed[" ", Background -> GrayLevel[0.8],
  FrameStyle -> AbsoluteThickness[2],
  FrameMargins -> {{0, 6}, {40, 40}}]

